
Visualization through Image and Simulation (VIS)
Two demonstrators have emerge from the project. The first one - called VIS-Ed – is intended to be used in education of health care professionals (Figure 1 and 2). The other one – VISatlas – is a web-based platform that visualizes the simulations. VISatlas can be used as a reference book where users can interactively choose course, size of acceleration and the area and grade of violence of an impact (Figure 3).

Figure 1. A part from the VIS-Ed program, where the user can interview a virtual patient and order for example medical images.
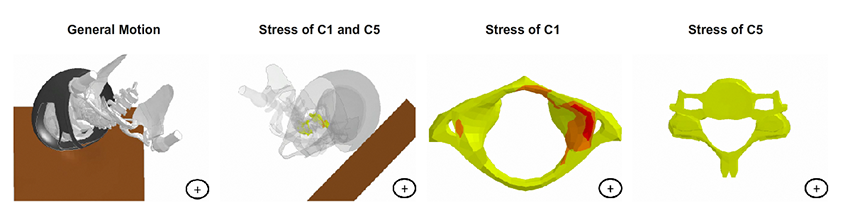
Figure 2. VIS-Ed, showing the effect on C1 and C5 during an motorcycle accident

Figure 3. Example from the VISatlas
Collaboration
Karolinska University Hospital
Karolinska Institute
SenseGraphics