Hoppa till huvudinnehållet
Till KTH:s startsida

Experimental developments

A narrow bandwidth extreme ultra-violet light source for time- and angle-resolved photoemission spectroscopy


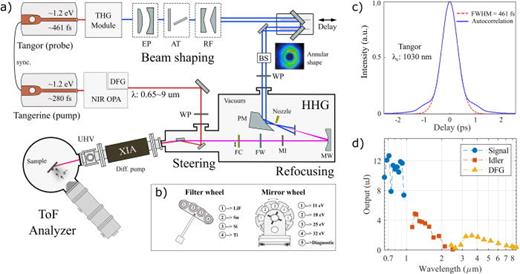
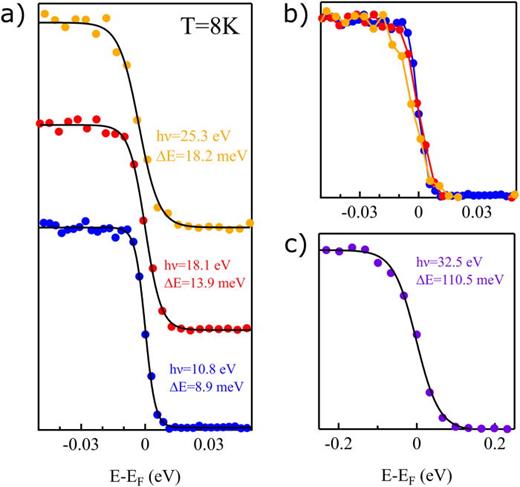
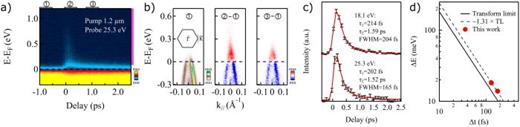
Here, we present a high repetition rate, narrow bandwidth, extreme ultraviolet photon source for time- and angle-resolved photoemission spectroscopy. The narrow bandwidth pulses 9, 14 and 18  meV for photon energies 10.8, 18.1 and 25.3  eV are generated through high harmonic generation using ultra-violet drive pulses with relatively long pulse lengths (461 fs). The high harmonic generation setup employs an annular drive beam in tight focusing geometry at a repetition rate of 250 kHz. Photon energy selection is provided by a series of selectable multilayer bandpass mirrors and thin film filters, thus avoiding any time broadening introduced by single grating monochromators. A two stage optical-parametric amplifier provides < 100 fs tunable pump pulses from 0.65 μm to 9 μm. The narrow bandwidth performance of the light source is demonstrated through angle-resolved photoemission measurements on a series of quantum materials, including high-temperature superconductor Bi-2212, WSe2, and graphene.


Schematic overview of the BALTAZAR systems


FIG. 2. Schematic overview of the HHG-based time-resolved ARPES setup. (a) The layout of the setup, showing the pump and probe lines. EP: expander, AT: attenuator, RF: reflective axicons, BS: beam stabilization, WP: waveplate, PM: parabolic mirror, MW: mirror wheel, MI: motorized iris, FW: filter wheel, and FC: flux check. (b) Drawings of the mirror- and filter-wheels that are used for wavelength selection. (c) Temporal profile of the ∼461-fs-long ultraviolet (UV) pulse used for driving the HHG probe-line. (d) OPA performance, depicting the average pulse energy as a function of the output wavelength in semi-logarithmic scale.

Energy resolution for various photon energies


FIG. 5. Fermi edge measurements on polycrystalline Au taken at 8 K. (a) Data acquired at 10.8 eV (blue), 18.1 eV (red), and 25.3 eV (yellow) plotted with a vertical offset. Solid black lines are fits using a convolution of the temperature dependent Fermi-Dirac function with a Gaussian function, where the full-width at half maximum of the Gaussian represents the overall system energy resolution. (b) The same data without vertical offset. (c) Results for 32.5 eV. Purple dots represent data, and black line is the fit.


Time resolution determine by pump-probe spectroscopy on Graphene


FIG. 8. Pump–probe measurements on p-doped graphene measured with 25.3 eV photons. (a) Ultrafast dynamics of the graphene, excited with a pump beam of 1.2 μm wavelength and ∼100 fs pulse duration. Purple vertical line indicates the integration range in energy for the corresponding delay curve displayed in panel (c). (b) From left to right: energy dispersion cuts from a static measurement without pump (①), at the excitation time (t0, ②-①) and 1 ps after t0 (③-①). (c) Fit to the decay data. The decay data are taken from an integration of the energy window marked by the purple line on the right side of (a). The fitting profile is a two-component exponential decay curve convoluted with a Gaussian function. (d) Energy resolution (ΔE) vs time resolution (Δt) for the photon energies of 18.1 eV and 25.3 eV, the solid line shows the theoretically resolution limit assuming a Fourier transform limited Gaussian pulse.


Struct. Dyn. 9, 024304 (2022)

https://doi.org/10.1063/4.0000149


Profilbild av Oscar Tjernberg

Portfolio