Visualization
Analysis of data is an increasingly important part of research workflows in all academia, industry, and government. We develop visual data analysis methods targeting large and complex data sets with the goal to effectively share cognitive load between computers and humans.
Visualization and Data Analysis
Analyzing large and high-dimensional data sets is a challenging task and is ideally carried out using sophisticated tools which make it possible to concentrate on the most relevant information and to automate the analysis. These goals can be achieved using feature-based methods, which foster target-oriented studies of the most important aspects of a data set.
We develop algorithms and mathematical models to analyze data sets from a variety of different domains such as fluid dynamics, meteorology, planetology, and cell biology. A basis of our work is discrete Morse theory, as it allows robust, parameter-free, and topologically consistent computations. Our goal in this area is to develop solutions to the open problems of discrete Morse theory to make discrete approaches applicable for a large number of practical applications.
We see a great need for sophisticated data analysis in the context of high-performance computing. For decades to come, supercomputing applications like flow and climate research will exhaust the computational power of the largest supercomputers to perform more detailed simulations and get a better understanding of the underlying physical phenomena. Running at the brink of high-performance computing, these applications face the following Big Data barriers:
- Data Size: It is infeasible to save the entire simulation data to disk. This would require more storage space than available. Current solutions include saving only selected time steps.
- Data Complexity: Even if it were possible to save the simulation data in a reasonable resolution, sophisticated analysis methods that scale with the complexity of the data are lacking. Current solutions often cannot assess complex phenomena in detail, but instead aggregate simple statistics during the simulation and analyze them later on desktop hardware.
We develop methods to shift parts of the data analysis on the supercomputer to run alongside the simulation (in-situ) where the data can be accessed in full resolution. Automated, feature-based methods are our target for this line of research.
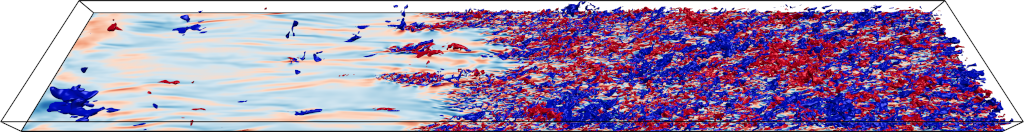

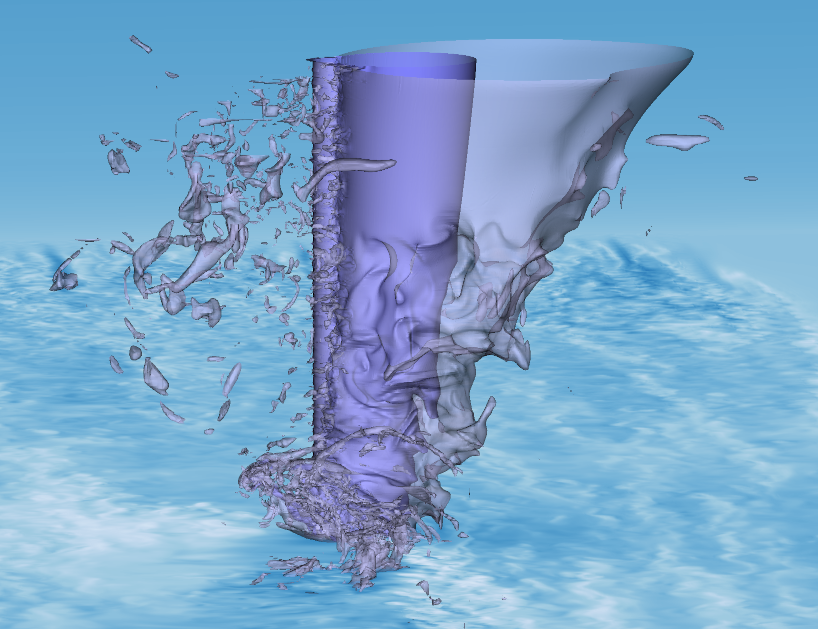
Turbulence develops over a flat plate, here shown via spanwise velocity. The goal is to segment the domain into laminar and turbulent regions. Our method extracts topological data in-situ during the simulation in a memory-distributed setup. A subsequent kernel density estimation reveals the desired domain segmentation. from: Jiahui Liu, Tobias Edwards, Kristina Ðurović, Philipp Schlatter, Tino Weinkauf, In-Situ Binary Segmentation of 3D time-dependent Flows into Laminar and Turbulent Regions, ICPP 2024 Data courtesy of Kristina Ðurović, Ardeshir Hanifi, Philipp Schlatter, Kenzo Sasaki and Dan S. Henningson, funded through Dan Henningson's ERC grant 694452-TRANSEP-ERC-2015-AdG and computed on resources of the Swedish National Infrastructure for Computing (SNIC).
Visualization and AI
Visualization strives to represent abstract data in an unbiased manner to users. Visual analysis workflows put the responsibility for data interpretation on the user. This approach exploits and elicits human perception, cognition, and context. It is an ideal setup to connect human intelligence to artificial intelligence.
For example, reinforcement learning and other learning methods benefit from human-in-the-loop approaches. Interactive visualization serves as a key enabling technology to elicit human preferences and to reveal the structure of the underlying domain spaces. These approaches grant agency to users and lighten the workload when training networks with human preferences.
Visualization for HRI and Embodied AI

Animation and simulation of full-body humanoid behaviour (including gestures, facial expressions, emotions and group interactions) for application to virtual characters and social robots.
Kiran Chhatre, Radek Danecek, Nikos Athanasiou, Giorgio Becherini, Christopher Peters, Michael J. Black, Timo Bolkart, Emotional Speech-Driven 3D Body Animation via Disentangled Latent Diffusion. CVPR 2024 funded through CLIPE EC H2020 MSCA ITN.
InfraVis - The Swedish Research Infrastructure for Visualization Support
Our group at KTH is one of nine nodes of InfraVis, which is a VR-funded research infrastructure established in Sweden in 2022. This human infrastructure employs over 50 experts in visualization, data analysis, and AI (20 full-time equivalents). Our expertise, services, labs, and education are available to all researchers in Sweden and in all domains of science. Many of our services are provided free of charge. Our goal is to elevate Swedish research by fostering the adoption of modern visual data analysis tools.
We believe that essentially all academic research of today relies on analysis of data from a wide range of sources. Data is collected through experiments, simulations, text analysis, sensors, modeling, surveys, and other means. Scientific progress hinges on the understanding of this data. Scientists in all domains increasingly face challenges when analyzing their data such as its sheer size, its high dimensionality, its noise level, or the complexity of data. They need effective tools to uncover correlations, causations, and intricate relationships within complex data sets.
Tackling these data challenges is typically not within the expertise of the domain scientists, but it requires expert knowledge in data analysis and visualization. It is often not a viable option for domain scientists to obtain visualization expertise themselves, or to hire dedicated visualization experts into their research groups.
Researchers