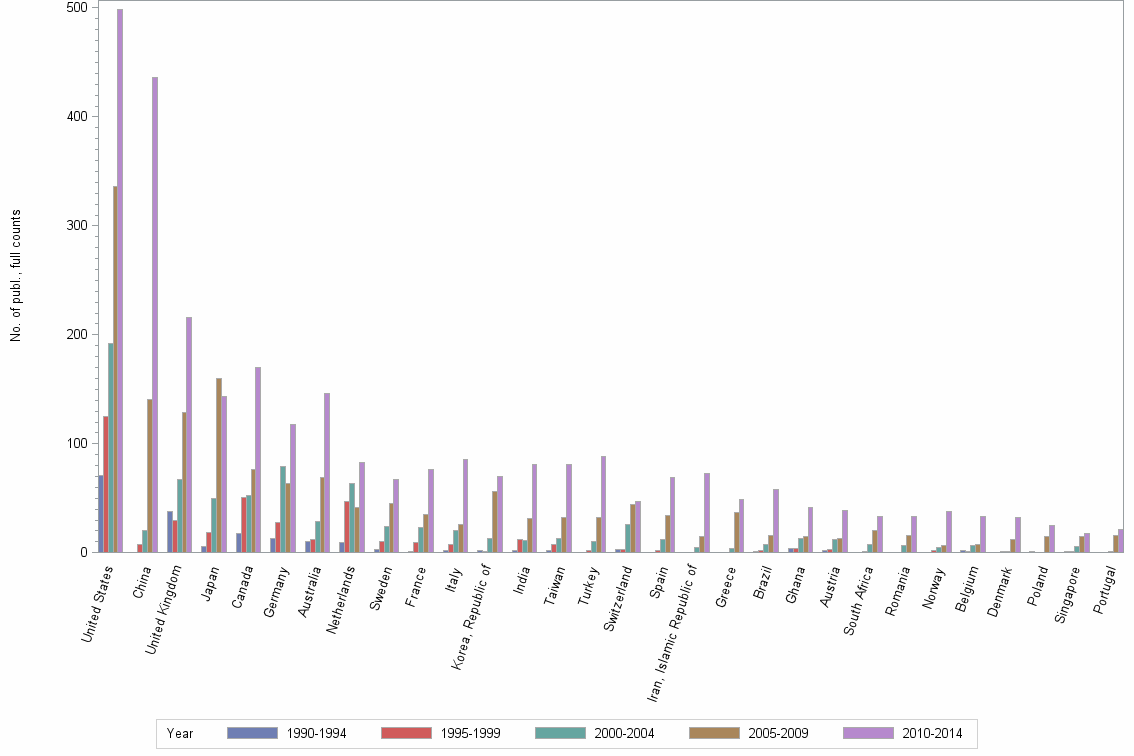
Lev4: ECONOMICS//OPERATIONS RESEARCH & MANAGEMENT SCIENCE//BUSINESS - Statistics for Countries

Statistics per Country

Number of publications, full counts

Obs Country 1990-1994 1995-1999 2000-2004 2005-2009 2010-2014 All years
1 All countries 233 415 707 1396 2570 5321
2 United States 71 125 192 336 499 1223
3 China . 8 20 141 436 605
4 United Kingdom 38 30 67 129 216 480
5 Japan 6 19 50 160 143 378
6 Canada 18 51 53 76 170 368
7 Germany 13 28 79 64 118 302
8 Australia 10 12 29 69 146 266
9 Netherlands 9 47 64 42 83 245
10 Sweden 3 10 24 45 67 149
11 France 1 9 23 35 76 144
12 Italy 2 8 20 26 86 142
13 Korea, Republic of 2 1 13 56 70 142
14 India 2 12 11 31 81 137
15 Taiwan 2 8 13 32 81 136
16 Turkey . 2 10 32 88 132
17 Switzerland 3 3 26 44 47 123
18 Spain . 2 12 34 69 117
19 Iran, Islamic Republic of . . 5 15 73 93
20 Greece . . 4 37 49 90
21 Brazil 1 2 8 16 58 85
22 Ghana 4 4 13 15 42 78
23 Austria 2 3 12 13 39 69
24 South Africa . 1 8 20 33 62
25 Romania . . 7 16 33 56
26 Norway . 2 5 7 38 52
27 Belgium 2 1 7 8 33 51
28 Denmark . 1 1 12 32 46
29 Poland 1 . . 15 25 41
30 Singapore 1 1 6 15 18 41
31 Portugal . . 1 16 21 38
32 Chile 1 3 4 8 21 37
33 Malaysia . . . 4 26 30
34 Nigeria . . 1 9 16 26
35 Finland . 2 2 5 13 22
36 Ireland . 1 4 6 11 22
37 Republic of Serbia . . . . 20 20
38 Russian Federation 2 1 3 6 7 19
39 Mexico . 2 1 2 13 18
40 New Zealand . 1 2 7 8 18
41 Hungary . 2 5 2 7 16
42 Tanzania . 1 . 7 8 16
43 Ecuador . . 3 . 11 14
44 Czech Republic . . . 4 9 13
45 Israel . 3 3 2 4 12
46 Pakistan . . . 3 8 11
47 Thailand . . . 3 8 11
48 Peru . . 1 2 7 10
49 Slovak Republic . 1 . 1 8 10
50 Indonesia 1 . 2 . 6 9
51 Philippines 1 2 . 4 2 9
52 Slovenia . . . 1 8 9
53 Zimbabwe . 1 3 2 3 9

Number of publications, full counts


Bar chart of publication_year

Share of the total number of publications in the field, full counts (%)

Obs Country 1990-1994 1995-1999 2000-2004 2005-2009 2010-2014 All years
1 All countries 100.0 100.0 100.0 100.0 100.0 100.0
2 United States 30.5 30.1 27.2 24.1 19.4 23.0
3 China . 1.9 2.8 10.1 17.0 11.4
4 United Kingdom 16.3 7.2 9.5 9.2 8.4 9.0
5 Japan 2.6 4.6 7.1 11.5 5.6 7.1
6 Canada 7.7 12.3 7.5 5.4 6.6 6.9
7 Germany 5.6 6.7 11.2 4.6 4.6 5.7
8 Australia 4.3 2.9 4.1 4.9 5.7 5.0
9 Netherlands 3.9 11.3 9.1 3.0 3.2 4.6
10 Sweden 1.3 2.4 3.4 3.2 2.6 2.8
11 France 0.4 2.2 3.3 2.5 3.0 2.7
12 Italy 0.9 1.9 2.8 1.9 3.3 2.7
13 Korea, Republic of 0.9 0.2 1.8 4.0 2.7 2.7
14 India 0.9 2.9 1.6 2.2 3.2 2.6
15 Taiwan 0.9 1.9 1.8 2.3 3.2 2.6
16 Turkey . 0.5 1.4 2.3 3.4 2.5
17 Switzerland 1.3 0.7 3.7 3.2 1.8 2.3
18 Spain . 0.5 1.7 2.4 2.7 2.2
19 Iran, Islamic Republic of . . 0.7 1.1 2.8 1.7
20 Greece . . 0.6 2.7 1.9 1.7
21 Brazil 0.4 0.5 1.1 1.1 2.3 1.6
22 Ghana 1.7 1.0 1.8 1.1 1.6 1.5
23 Austria 0.9 0.7 1.7 0.9 1.5 1.3
24 South Africa . 0.2 1.1 1.4 1.3 1.2
25 Romania . . 1.0 1.1 1.3 1.1
26 Norway . 0.5 0.7 0.5 1.5 1.0
27 Belgium 0.9 0.2 1.0 0.6 1.3 1.0
28 Denmark . 0.2 0.1 0.9 1.2 0.9
29 Poland 0.4 . . 1.1 1.0 0.8
30 Singapore 0.4 0.2 0.8 1.1 0.7 0.8
31 Portugal . . 0.1 1.1 0.8 0.7
32 Chile 0.4 0.7 0.6 0.6 0.8 0.7
33 Malaysia . . . 0.3 1.0 0.6
34 Nigeria . . 0.1 0.6 0.6 0.5
35 Finland . 0.5 0.3 0.4 0.5 0.4
36 Ireland . 0.2 0.6 0.4 0.4 0.4
37 Republic of Serbia . . . . 0.8 0.4
38 Russian Federation 0.9 0.2 0.4 0.4 0.3 0.4
39 Mexico . 0.5 0.1 0.1 0.5 0.3
40 New Zealand . 0.2 0.3 0.5 0.3 0.3
41 Hungary . 0.5 0.7 0.1 0.3 0.3
42 Tanzania . 0.2 . 0.5 0.3 0.3
43 Ecuador . . 0.4 . 0.4 0.3
44 Czech Republic . . . 0.3 0.4 0.2
45 Israel . 0.7 0.4 0.1 0.2 0.2
46 Pakistan . . . 0.2 0.3 0.2
47 Thailand . . . 0.2 0.3 0.2
48 Peru . . 0.1 0.1 0.3 0.2
49 Slovak Republic . 0.2 . 0.1 0.3 0.2
50 Indonesia 0.4 . 0.3 . 0.2 0.2
51 Philippines 0.4 0.5 . 0.3 0.1 0.2
52 Slovenia . . . 0.1 0.3 0.2
53 Zimbabwe . 0.2 0.4 0.1 0.1 0.2

Share of the total number of publications in the field, full counts (%)


Bar chart of publication_year

Number of publications among 10% most cited in field, full counts

Obs Country 1990-1994 1995-1999 2000-2004 2005-2009 2010-2014 All years
1 All countries 14.4 63.4 102.2 225.4 347.0 752.4
2 United States 4.1 26.0 39.5 74.1 81.4 225.1
3 China . 0.0 0.5 25.6 63.6 89.8
4 United Kingdom 4.4 0.4 3.8 29.8 37.8 76.2
5 Japan 1.2 1.8 3.3 11.7 10.9 28.8
6 Canada 1.0 3.5 4.5 10.2 28.2 47.4
7 Germany 1.0 7.7 11.8 15.4 16.1 52.0
8 Australia 0.0 0.7 4.0 8.7 25.6 38.9
9 Netherlands 0.0 18.5 15.9 8.5 22.0 64.9
10 Sweden 0.0 3.0 1.0 6.2 3.1 13.3
11 France 0.0 3.9 9.2 11.9 10.9 35.8
12 Italy 1.0 0.0 1.7 3.7 15.4 21.8
13 Korea, Republic of 0.0 0.0 2.8 8.0 7.7 18.4
14 India 0.0 0.8 1.0 14.0 14.2 30.0
15 Taiwan 0.3 0.0 6.3 5.0 15.3 27.0
16 Turkey . 0.0 4.8 9.3 19.8 33.9
17 Switzerland 0.3 0.5 4.0 6.7 9.6 21.1
18 Spain . 0.0 1.2 4.7 3.8 9.6
19 Iran, Islamic Republic of . . 0.0 3.0 20.0 23.0
20 Greece . . 1.0 6.1 4.6 11.6
21 Brazil 0.0 0.0 1.3 3.2 7.1 11.7
22 Ghana 0.0 0.0 0.0 2.0 3.1 5.1
23 Austria 0.0 0.0 2.0 1.5 4.5 8.0
24 South Africa . 0.0 1.0 0.7 2.0 3.7
25 Romania . . 0.0 0.0 2.7 2.7
26 Norway . 0.0 1.0 3.0 9.9 13.9
27 Belgium 1.0 0.0 1.7 5.5 6.4 14.6
28 Denmark . 0.0 0.0 0.5 10.2 10.7
29 Poland 0.0 . . 1.0 0.0 1.0
30 Singapore 0.0 0.0 1.0 6.0 4.5 11.5
31 Portugal . . 0.0 3.3 4.1 7.4
32 Chile 0.0 0.0 0.0 0.0 0.2 0.2
33 Malaysia . . . 0.0 1.3 1.3
34 Nigeria . . 0.0 0.7 0.4 1.1
35 Finland . 0.0 0.3 0.0 1.3 1.7
36 Ireland . 0.0 0.8 0.2 0.0 1.0
37 Republic of Serbia . . . . 0.0 0.0
38 Russian Federation 0.0 0.0 0.0 0.0 0.0 0.0
39 Mexico . 0.0 0.0 0.0 1.5 1.5
40 New Zealand . 0.0 0.0 1.0 2.0 3.0
41 Hungary . 0.0 3.0 1.0 0.0 4.0
42 Tanzania . 0.0 . 0.0 0.0 0.0
43 Ecuador . . 0.0 . 1.4 1.4
44 Czech Republic . . . 0.0 0.0 0.0
45 Israel . 1.0 1.5 0.0 1.2 3.7
46 Pakistan . . . 1.0 1.0 2.0
47 Thailand . . . 0.0 0.0 0.0
48 Peru . . 0.0 1.0 2.5 3.5
49 Slovak Republic . 0.0 . 0.0 0.7 0.7
50 Indonesia 0.0 . 0.0 . 0.0 0.0
51 Philippines 0.0 0.0 . 0.0 0.3 0.3
52 Slovenia . . . 0.0 0.0 0.0
53 Zimbabwe . 0.0 0.0 0.0 1.0 1.0

Number of publications among 10% most cited in field, full counts


Bar chart of publication_year

Share of publications among 10% most cited in field, fractionalized (%)

Obs Country 1990-1994 1995-1999 2000-2004 2005-2009 2010-2014 All years
1 All countries 6.2 15.3 14.5 16.1 13.6 14.2
2 United States 5.9 21.2 19.2 20.5 15.5 17.5
3 China . 0.0 3.0 18.9 13.6 14.3
4 United Kingdom 11.6 1.2 5.2 22.9 16.2 14.8
5 Japan 12.1 10.3 5.9 5.9 7.7 6.8
6 Canada 2.9 6.7 6.3 9.1 16.0 10.8
7 Germany 7.7 29.1 13.8 18.7 12.1 15.6
8 Australia 0.0 6.1 15.9 11.6 16.3 13.8
9 Netherlands 0.0 40.1 24.9 21.9 26.2 27.2
10 Sweden 0.0 33.3 4.9 12.3 5.4 9.3
11 France 0.0 35.8 29.7 29.0 10.6 19.3
12 Italy 50.0 0.0 8.4 14.4 16.1 14.2
13 Korea, Republic of 0.0 0.0 25.4 11.7 8.7 11.3
14 India 0.0 2.3 3.7 40.8 12.0 17.2
15 Taiwan 22.2 0.0 46.8 16.0 18.8 19.7
16 Turkey . 0.0 33.8 25.9 20.3 22.2
17 Switzerland 11.1 16.7 20.5 14.9 18.2 17.2
18 Spain . 0.0 6.3 13.7 4.6 7.4
19 Iran, Islamic Republic of . . 0.0 16.9 25.1 22.3
20 Greece . . 42.9 16.4 9.3 13.4
21 Brazil 0.0 0.0 16.9 17.7 14.2 14.6
22 Ghana 0.0 0.0 0.0 7.1 4.4 3.5
23 Austria 0.0 0.0 20.9 10.7 8.2 9.7
24 South Africa . 0.0 13.0 2.4 5.5 5.4
25 Romania . . 0.0 0.0 5.4 3.1
26 Norway . 0.0 27.3 34.5 24.8 25.8
27 Belgium 50.0 0.0 15.4 65.2 13.6 22.3
28 Denmark . 0.0 0.0 5.9 28.2 20.7
29 Poland 0.0 . . 0.7 0.0 0.2
30 Singapore 0.0 0.0 16.7 40.5 18.0 25.2
31 Portugal . . 0.0 20.5 18.3 18.9
32 Chile 0.0 0.0 0.0 0.0 0.9 0.5
33 Malaysia . . . 0.0 6.1 5.2
34 Nigeria . . 0.0 7.4 1.0 3.8
35 Finland . 0.0 11.1 0.0 10.9 7.3
36 Ireland . 0.0 21.1 1.6 0.0 6.4
37 Republic of Serbia . . . . 0.0 0.0
38 Russian Federation 0.0 0.0 0.0 0.0 0.0 0.0
39 Mexico . 0.0 0.0 0.0 5.3 3.5
40 New Zealand . 0.0 0.0 28.6 21.8 18.0
41 Hungary . 0.0 62.5 42.9 0.0 26.7
42 Tanzania . 0.0 . 0.0 0.0 0.0
43 Ecuador . . 0.0 . 7.3 5.9
44 Czech Republic . . . 0.0 0.0 0.0
45 Israel . 20.0 37.5 0.0 23.9 20.0
46 Pakistan . . . 33.3 13.1 20.6
47 Thailand . . . 0.0 0.0 0.0
48 Peru . . 0.0 54.5 27.2 32.3
49 Slovak Republic . 0.0 . 0.0 9.5 7.4
50 Indonesia 0.0 . 0.0 . 0.0 0.0
51 Philippines 0.0 0.0 . 0.0 6.7 1.3
52 Slovenia . . . 0.0 0.0 0.0
53 Zimbabwe . 0.0 0.0 0.0 47.8 15.6

Share of publications among 10% most cited in field, fractionalized (%)


Bar chart of publication_year

Field normalized citation rate (cf), fractionalized

Obs Country 1990-1994 1995-1999 2000-2004 2005-2009 2010-2014 All years
1 All countries 0.66 1.23 1.24 1.34 1.21 1.22
2 United States 0.83 1.57 1.50 1.58 1.31 1.41
3 China . 0.43 0.67 1.63 1.20 1.28
4 United Kingdom 0.70 0.50 0.86 1.61 1.17 1.15
5 Japan 0.84 0.93 0.87 0.75 0.77 0.78
6 Canada 0.52 0.71 1.04 0.97 1.37 1.08
7 Germany 0.70 1.91 1.04 1.34 1.07 1.19
8 Australia 0.11 0.64 1.02 1.05 1.44 1.19
9 Netherlands 0.48 2.75 1.85 1.85 1.80 1.98
10 Sweden 0.65 1.45 1.34 1.11 0.96 1.10
11 France 0.76 1.80 2.53 2.47 1.28 1.77
12 Italy 2.08 0.49 1.05 1.18 1.65 1.40
13 Korea, Republic of 0.29 1.45 1.78 1.25 0.89 1.11
14 India 0.91 0.47 0.49 2.39 1.28 1.40
15 Taiwan 1.42 0.63 2.42 1.27 1.34 1.38
16 Turkey . 0.20 1.57 1.40 1.49 1.46
17 Switzerland 1.99 0.90 1.69 1.68 1.43 1.58
18 Spain . 1.84 1.07 1.25 0.75 0.95
19 Iran, Islamic Republic of . . 0.56 1.28 2.28 2.02
20 Greece . . 1.62 1.14 1.10 1.13
21 Brazil 0.11 0.69 1.11 1.23 1.03 1.06
22 Ghana 0.25 0.83 0.71 0.73 0.60 0.64
23 Austria 0.71 0.51 1.10 1.20 0.86 0.92
24 South Africa . 0.19 1.12 0.48 0.38 0.51
25 Romania . . 0.25 0.21 0.60 0.44
26 Norway . 0.57 1.93 2.40 1.77 1.85
27 Belgium 3.51 1.99 1.64 3.34 1.63 1.97
28 Denmark . 0.48 0.69 1.31 2.09 1.80
29 Poland 0.11 . . 0.30 0.26 0.27
30 Singapore 0.42 0.07 1.00 2.86 1.48 1.84
31 Portugal . . 0.41 1.87 2.04 1.93
32 Chile 0.64 0.73 0.48 0.73 0.75 0.70
33 Malaysia . . . 0.53 0.75 0.71
34 Nigeria . . 0.00 1.22 0.41 0.75
35 Finland . 0.23 0.81 0.59 1.24 0.96
36 Ireland . 0.19 1.25 0.36 0.63 0.69
37 Republic of Serbia . . . . 0.43 0.43
38 Russian Federation 0.10 0.14 0.23 0.14 0.14 0.15
39 Mexico . 0.32 0.18 1.08 0.54 0.53
40 New Zealand . 0.00 1.20 2.22 1.31 1.46
41 Hungary . 0.94 3.08 1.62 0.55 1.59
42 Tanzania . 0.69 . 0.90 0.82 0.85
43 Ecuador . . 1.00 . 0.79 0.83
44 Czech Republic . . . 0.21 0.56 0.45
45 Israel . 1.92 2.83 0.74 1.36 1.64
46 Pakistan . . . 3.42 1.30 2.09
47 Thailand . . . 1.13 0.47 0.68
48 Peru . . 2.05 3.84 1.72 2.32
49 Slovak Republic . 0.00 . 0.06 0.72 0.57
50 Indonesia 0.29 . 0.50 . 0.99 0.76
51 Philippines 0.10 0.73 . 0.43 0.48 0.46
52 Slovenia . . . 0.09 0.14 0.13
53 Zimbabwe . 0.06 0.81 0.47 3.00 1.34

Field normalized citation rate (cf), fractionalized


Bar chart of publication_year