Lev3: LITHIUM ION BATTERY//LITHIUM ION BATTERIES//JOURNAL OF POWER SOURCES - Statistics for Countries

Statistics per Country

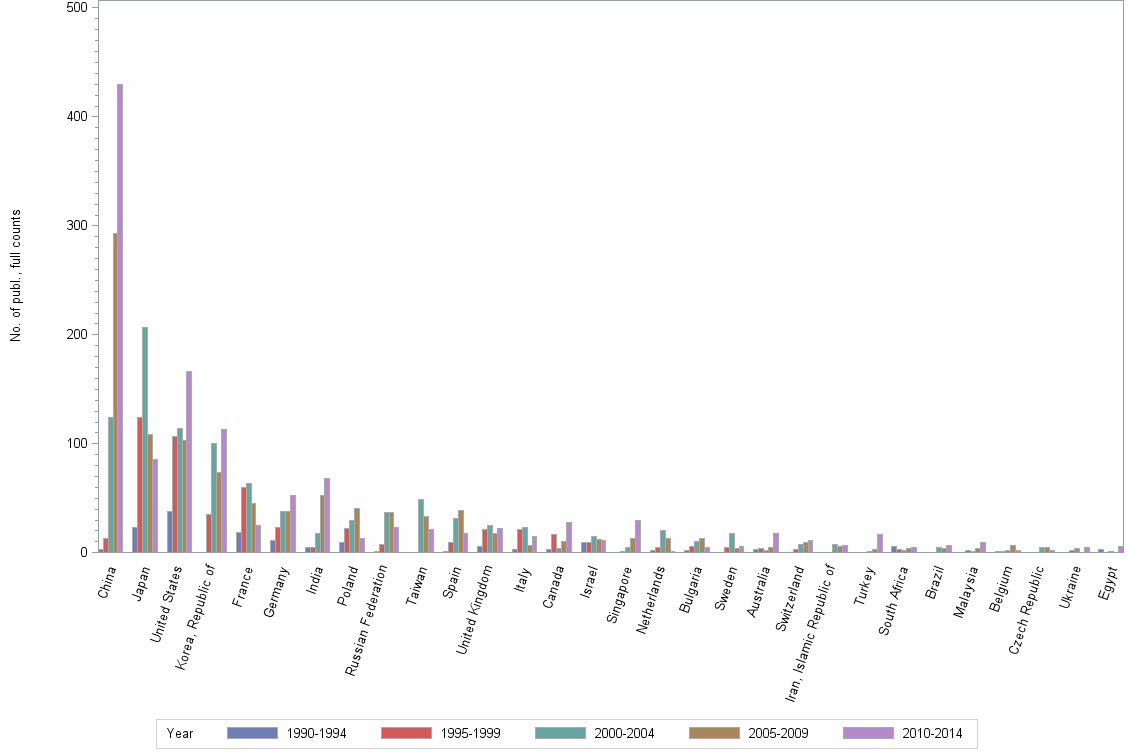
Number of publications, full counts

Obs Country 1990-1994 1995-1999 2000-2004 2005-2009 2010-2014 All years
1 All countries 117 434 806 824 1000 3181
2 China 3 13 124 293 430 863
3 Japan 23 124 207 109 86 549
4 United States 38 107 114 103 166 528
5 Korea, Republic of . 35 100 74 113 322
6 France 19 60 64 45 25 213
7 Germany 11 23 38 38 53 163
8 India 5 5 18 53 68 149
9 Poland 9 22 30 41 13 115
10 Russian Federation 1 8 37 37 23 106
11 Taiwan . . 49 33 21 103
12 Spain 1 9 31 39 18 98
13 United Kingdom 6 21 25 18 22 92
14 Italy 3 21 23 7 15 69
15 Canada 3 17 4 10 28 62
16 Israel 9 9 15 12 11 56
17 Singapore . 1 5 13 30 49
18 Netherlands 2 5 20 13 1 41
19 Bulgaria 2 6 10 13 5 36
20 Sweden . 5 18 4 6 33
21 Australia 3 4 2 5 18 32
22 Switzerland . 3 8 9 11 31
23 Iran, Islamic Republic of . . 8 6 7 21
24 Turkey . . 1 3 17 21
25 South Africa 6 3 2 4 5 20
26 Brazil . . 5 4 7 16
27 Malaysia . 2 1 4 9 16
28 Belgium 1 1 2 7 2 13
29 Czech Republic . . 5 5 2 12
30 Ukraine . 2 4 . 5 11
31 Egypt 3 . 1 . 6 10
32 Austria . 1 . 3 4 8
33 Denmark . 3 1 . 4 8
34 Saudi Arabia . . . . 8 8
35 Chile . 1 1 3 2 7
36 Mexico . 1 1 3 2 7
37 New Zealand 1 5 . 1 . 7
38 Norway 1 4 2 . . 7
39 Greece . 3 2 1 . 6
40 Morocco . 1 . 2 3 6
41 Pakistan . . . 2 4 6
42 Tunisia 2 1 . 3 . 6
43 Romania . 1 . . 4 5
44 Rep of Georgia . 1 1 2 . 4
45 Ireland . . . 1 2 3
46 Republic of Serbia . . . 3 . 3
47 USSR 3 . . . . 3
48 Viet Nam . . 1 . 2 3
49 Yugoslavia . 1 2 . . 3
50 Algeria . . . . 2 2
51 Finland . . . 2 . 2
52 Portugal . 1 . . 1 2
53 Slovak Republic . . 1 . 1 2

Number of publications, full counts


Bar chart of publication_year

Share of the total number of publications in the field, full counts (%)

Obs Country 1990-1994 1995-1999 2000-2004 2005-2009 2010-2014 All years
1 All countries 100.0 100.0 100.0 100.0 100.0 100.0
2 China 2.6 3.0 15.4 35.6 43.0 27.1
3 Japan 19.7 28.6 25.7 13.2 8.6 17.3
4 United States 32.5 24.7 14.1 12.5 16.6 16.6
5 Korea, Republic of . 8.1 12.4 9.0 11.3 10.1
6 France 16.2 13.8 7.9 5.5 2.5 6.7
7 Germany 9.4 5.3 4.7 4.6 5.3 5.1
8 India 4.3 1.2 2.2 6.4 6.8 4.7
9 Poland 7.7 5.1 3.7 5.0 1.3 3.6
10 Russian Federation 0.9 1.8 4.6 4.5 2.3 3.3
11 Taiwan . . 6.1 4.0 2.1 3.2
12 Spain 0.9 2.1 3.8 4.7 1.8 3.1
13 United Kingdom 5.1 4.8 3.1 2.2 2.2 2.9
14 Italy 2.6 4.8 2.9 0.8 1.5 2.2
15 Canada 2.6 3.9 0.5 1.2 2.8 1.9
16 Israel 7.7 2.1 1.9 1.5 1.1 1.8
17 Singapore . 0.2 0.6 1.6 3.0 1.5
18 Netherlands 1.7 1.2 2.5 1.6 0.1 1.3
19 Bulgaria 1.7 1.4 1.2 1.6 0.5 1.1
20 Sweden . 1.2 2.2 0.5 0.6 1.0
21 Australia 2.6 0.9 0.2 0.6 1.8 1.0
22 Switzerland . 0.7 1.0 1.1 1.1 1.0
23 Iran, Islamic Republic of . . 1.0 0.7 0.7 0.7
24 Turkey . . 0.1 0.4 1.7 0.7
25 South Africa 5.1 0.7 0.2 0.5 0.5 0.6
26 Brazil . . 0.6 0.5 0.7 0.5
27 Malaysia . 0.5 0.1 0.5 0.9 0.5
28 Belgium 0.9 0.2 0.2 0.8 0.2 0.4
29 Czech Republic . . 0.6 0.6 0.2 0.4
30 Ukraine . 0.5 0.5 . 0.5 0.3
31 Egypt 2.6 . 0.1 . 0.6 0.3
32 Austria . 0.2 . 0.4 0.4 0.3
33 Denmark . 0.7 0.1 . 0.4 0.3
34 Saudi Arabia . . . . 0.8 0.3
35 Chile . 0.2 0.1 0.4 0.2 0.2
36 Mexico . 0.2 0.1 0.4 0.2 0.2
37 New Zealand 0.9 1.2 . 0.1 . 0.2
38 Norway 0.9 0.9 0.2 . . 0.2
39 Greece . 0.7 0.2 0.1 . 0.2
40 Morocco . 0.2 . 0.2 0.3 0.2
41 Pakistan . . . 0.2 0.4 0.2
42 Tunisia 1.7 0.2 . 0.4 . 0.2
43 Romania . 0.2 . . 0.4 0.2
44 Rep of Georgia . 0.2 0.1 0.2 . 0.1
45 Ireland . . . 0.1 0.2 0.1
46 Republic of Serbia . . . 0.4 . 0.1
47 USSR 2.6 . . . . 0.1
48 Viet Nam . . 0.1 . 0.2 0.1
49 Yugoslavia . 0.2 0.2 . . 0.1
50 Algeria . . . . 0.2 0.1
51 Finland . . . 0.2 . 0.1
52 Portugal . 0.2 . . 0.1 0.1
53 Slovak Republic . . 0.1 . 0.1 0.1

Share of the total number of publications in the field, full counts (%)


Bar chart of publication_year

Number of publications among 10% most cited in field, full counts

Obs Country 1990-1994 1995-1999 2000-2004 2005-2009 2010-2014 All years
1 All countries 33.6 140.3 103.7 76.3 180.3 534.2
2 China 1.0 1.8 5.0 17.2 87.8 112.7
3 Japan 5.4 40.9 34.2 7.3 7.3 95.2
4 United States 16.0 50.5 26.2 22.9 51.9 167.5
5 Korea, Republic of . 12.0 20.4 11.5 30.4 74.3
6 France 5.2 18.2 8.4 6.6 4.5 42.9
7 Germany 3.0 6.4 2.8 3.5 3.9 19.6
8 India 0.0 2.0 0.9 2.7 5.9 11.6
9 Poland 0.0 0.0 0.5 0.0 0.0 0.5
10 Russian Federation 0.0 2.0 1.5 1.0 0.0 4.5
11 Taiwan . . 5.7 1.5 3.0 10.2
12 Spain 0.0 1.0 8.0 3.8 3.3 16.2
13 United Kingdom 4.0 12.2 1.5 5.0 3.1 25.8
14 Italy 3.0 6.5 2.0 2.0 4.2 17.7
15 Canada 3.0 10.1 0.5 1.1 3.9 18.6
16 Israel 1.0 5.0 3.5 3.0 3.0 15.5
17 Singapore . 0.8 1.8 3.5 9.2 15.3
18 Netherlands 0.0 0.0 2.5 0.0 0.0 2.5
19 Bulgaria 1.0 2.2 3.0 1.2 0.9 8.3
20 Sweden . 0.5 1.0 0.0 1.0 2.5
21 Australia 1.0 2.0 0.0 1.0 4.0 8.0
22 Switzerland . 1.0 1.0 1.9 0.0 3.9
23 Iran, Islamic Republic of . . 0.5 0.0 0.0 0.5
24 Turkey . . 0.0 1.0 2.5 3.5
25 South Africa 5.0 1.0 0.0 0.0 2.0 8.0
26 Brazil . . 0.0 0.0 0.0 0.0
27 Malaysia . 0.0 0.0 0.0 0.0 0.0
28 Belgium 0.0 0.0 0.0 0.0 0.0 0.0
29 Czech Republic . . 0.0 3.0 0.0 3.0
30 Ukraine . 0.0 0.0 . 0.0 0.0
31 Egypt 0.0 . 0.0 . 0.0 0.0
32 Austria . 0.0 . 2.0 0.0 2.0
33 Denmark . 0.4 0.0 . 0.0 0.4
34 Saudi Arabia . . . . 0.0 0.0
35 Chile . 0.0 0.0 0.0 0.0 0.0
36 Mexico . 0.0 1.0 0.0 0.0 1.0
37 New Zealand 1.0 2.0 . 0.0 . 3.0
38 Norway 0.0 1.0 0.0 . . 1.0
39 Greece . 0.0 0.0 0.0 . 0.0
40 Morocco . 0.0 . 1.0 1.0 2.0
41 Pakistan . . . 0.2 0.0 0.2
42 Tunisia 0.0 0.0 . 1.1 . 1.1
43 Romania . 0.0 . . 0.0 0.0
44 Rep of Georgia . 0.0 0.0 0.0 . 0.0
45 Ireland . . . 0.0 0.0 0.0
46 Republic of Serbia . . . 0.0 . 0.0
47 USSR 0.0 . . . . 0.0
48 Viet Nam . . 0.0 . 0.0 0.0
49 Yugoslavia . 0.0 0.0 . . 0.0
50 Algeria . . . . 0.0 0.0
51 Finland . . . 0.0 . 0.0
52 Portugal . 0.0 . . 0.0 0.0
53 Slovak Republic . . 0.0 . 0.0 0.0

Number of publications among 10% most cited in field, full counts


Bar chart of publication_year

Share of publications among 10% most cited in field, fractionalized (%)

Obs Country 1990-1994 1995-1999 2000-2004 2005-2009 2010-2014 All years
1 All countries 28.7 32.3 12.9 9.3 18.0 16.8
2 China 27.3 13.8 4.0 5.9 19.8 12.6
3 Japan 19.8 31.1 15.2 7.1 6.6 16.4
4 United States 43.1 48.8 23.7 23.4 33.2 33.2
5 Korea, Republic of . 32.6 17.5 13.6 23.6 20.5
6 France 18.3 26.1 14.8 16.5 15.9 19.0
7 Germany 26.3 21.2 8.7 4.8 3.3 9.7
8 India 0.0 39.1 5.8 5.4 7.8 7.4
9 Poland 0.0 0.0 1.9 0.0 0.0 0.5
10 Russian Federation 0.0 6.8 2.6 1.4 0.0 1.9
11 Taiwan . . 12.2 3.8 14.1 9.8
12 Spain 0.0 17.3 24.0 10.4 17.2 16.2
13 United Kingdom 71.4 57.5 4.4 35.8 10.3 32.5
14 Italy 100.0 29.4 7.1 12.3 20.9 21.8
15 Canada 100.0 62.6 15.8 6.5 17.5 36.7
16 Israel 11.5 46.8 28.4 25.7 39.2 30.0
17 Singapore . 84.6 36.0 27.8 33.6 33.7
18 Netherlands 0.0 0.0 14.2 0.0 0.0 7.3
19 Bulgaria 50.0 45.7 20.7 8.4 16.4 21.0
20 Sweden . 5.1 6.8 0.0 21.6 8.2
21 Australia 20.0 50.0 0.0 17.4 19.4 25.1
22 Switzerland . 25.0 11.8 13.3 0.0 9.5
23 Iran, Islamic Republic of . . 6.3 0.0 0.0 2.5
24 Turkey . . 0.0 33.3 13.6 16.2
25 South Africa 75.0 15.8 0.0 0.0 31.9 34.8
26 Brazil . . 0.0 0.0 0.0 0.0
27 Malaysia . 0.0 0.0 0.0 0.0 0.0
28 Belgium 0.0 0.0 0.0 0.0 0.0 0.0
29 Czech Republic . . 0.0 54.9 0.0 14.7
30 Ukraine . 0.0 0.0 . 0.0 0.0
31 Egypt 0.0 . 0.0 . 0.0 0.0
32 Austria . 0.0 . 85.7 0.0 46.8
33 Denmark . 13.3 0.0 . 0.0 4.5
34 Saudi Arabia . . . . 0.0 0.0
35 Chile . 0.0 0.0 0.0 0.0 0.0
36 Mexico . 0.0 100.0 0.0 0.0 12.9
37 New Zealand 100.0 39.1 . 0.0 . 45.9
38 Norway 0.0 28.6 0.0 . . 19.0
39 Greece . 0.0 0.0 0.0 . 0.0
40 Morocco . 0.0 . 50.0 30.0 31.6
41 Pakistan . . . 10.0 0.0 3.5
42 Tunisia 0.0 0.0 . 39.4 . 15.0
43 Romania . 0.0 . . 0.0 0.0
44 Rep of Georgia . 0.0 0.0 0.0 . 0.0
45 Ireland . . . 0.0 0.0 0.0
46 Republic of Serbia . . . 0.0 . 0.0
47 USSR 0.0 . . . . 0.0
48 Viet Nam . . 0.0 . 0.0 0.0
49 Yugoslavia . 0.0 0.0 . . 0.0
50 Algeria . . . . 0.0 0.0
51 Finland . . . 0.0 . 0.0
52 Portugal . 0.0 . . 0.0 0.0
53 Slovak Republic . . 0.0 . 0.0 0.0

Share of publications among 10% most cited in field, fractionalized (%)


Bar chart of publication_year

Field normalized citation rate (cf), fractionalized

Obs Country 1990-1994 1995-1999 2000-2004 2005-2009 2010-2014 All years
1 All countries 3.97 2.61 1.10 0.99 1.42 1.48
2 China 1.33 1.08 0.59 0.81 1.43 1.09
3 Japan 3.02 2.73 1.17 1.02 0.90 1.55
4 United States 6.03 3.94 1.68 1.82 2.33 2.69
5 Korea, Republic of . 2.60 1.48 1.12 1.87 1.67
6 France 2.77 2.39 1.21 1.26 1.51 1.76
7 Germany 3.16 1.91 1.19 0.76 0.82 1.27
8 India 0.16 1.31 0.65 0.66 0.85 0.75
9 Poland 0.11 0.24 0.58 0.41 0.56 0.42
10 Russian Federation 1.35 0.55 0.36 0.30 0.33 0.35
11 Taiwan . . 1.15 0.73 0.98 0.98
12 Spain 0.29 1.53 1.38 1.28 1.22 1.32
13 United Kingdom 4.82 2.95 0.96 3.15 1.62 2.41
14 Italy 8.33 1.66 1.41 1.30 2.29 1.89
15 Canada 18.11 5.55 1.22 0.69 1.49 3.60
16 Israel 0.80 4.61 1.56 1.32 1.81 1.87
17 Singapore . 3.13 1.80 1.48 2.45 2.07
18 Netherlands 0.22 0.95 0.74 0.64 0.17 0.70
19 Bulgaria 4.30 2.43 1.45 0.92 0.99 1.46
20 Sweden . 1.34 0.84 0.65 1.24 0.97
21 Australia 0.86 1.56 0.41 1.43 1.14 1.19
22 Switzerland . 1.08 1.46 1.42 0.52 1.12
23 Iran, Islamic Republic of . . 0.98 0.34 0.47 0.64
24 Turkey . . 0.20 1.31 0.93 0.95
25 South Africa 18.55 1.52 0.30 0.68 1.60 6.56
26 Brazil . . 0.56 0.64 0.41 0.52
27 Malaysia . 1.33 0.24 0.48 0.36 0.50
28 Belgium 1.75 1.17 0.27 0.37 0.52 0.65
29 Czech Republic . . 0.19 3.91 0.10 1.17
30 Ukraine . 0.09 0.40 . 0.33 0.28
31 Egypt 0.05 . 0.00 . 0.35 0.19
32 Austria . 0.14 . 5.32 1.11 3.36
33 Denmark . 1.18 0.41 . 1.32 1.13
34 Saudi Arabia . . . . 0.35 0.35
35 Chile . 0.15 0.32 0.04 0.11 0.11
36 Mexico . 0.23 3.87 0.22 0.54 0.79
37 New Zealand 2.47 2.38 . 0.31 . 2.06
38 Norway 0.76 1.60 0.79 . . 1.32
39 Greece . 1.02 0.28 0.10 . 0.59
40 Morocco . 0.29 . 2.68 1.02 1.43
41 Pakistan . . . 1.39 0.51 0.82
42 Tunisia 0.13 0.21 . 2.23 . 0.94
43 Romania . 1.18 . . 0.12 0.26
44 Rep of Georgia . 0.00 0.07 0.12 . 0.09
45 Ireland . . . 0.66 1.10 0.92
46 Republic of Serbia . . . 0.40 . 0.40
47 USSR 0.00 . . . . 0.00
48 Viet Nam . . 0.96 . 0.22 0.41
49 Yugoslavia . 0.15 0.29 . . 0.24
50 Algeria . . . . 0.30 0.30
51 Finland . . . 1.25 . 1.25
52 Portugal . 0.57 . . 2.35 1.16
53 Slovak Republic . . 0.55 . 1.96 1.36

Field normalized citation rate (cf), fractionalized


Bar chart of publication_year