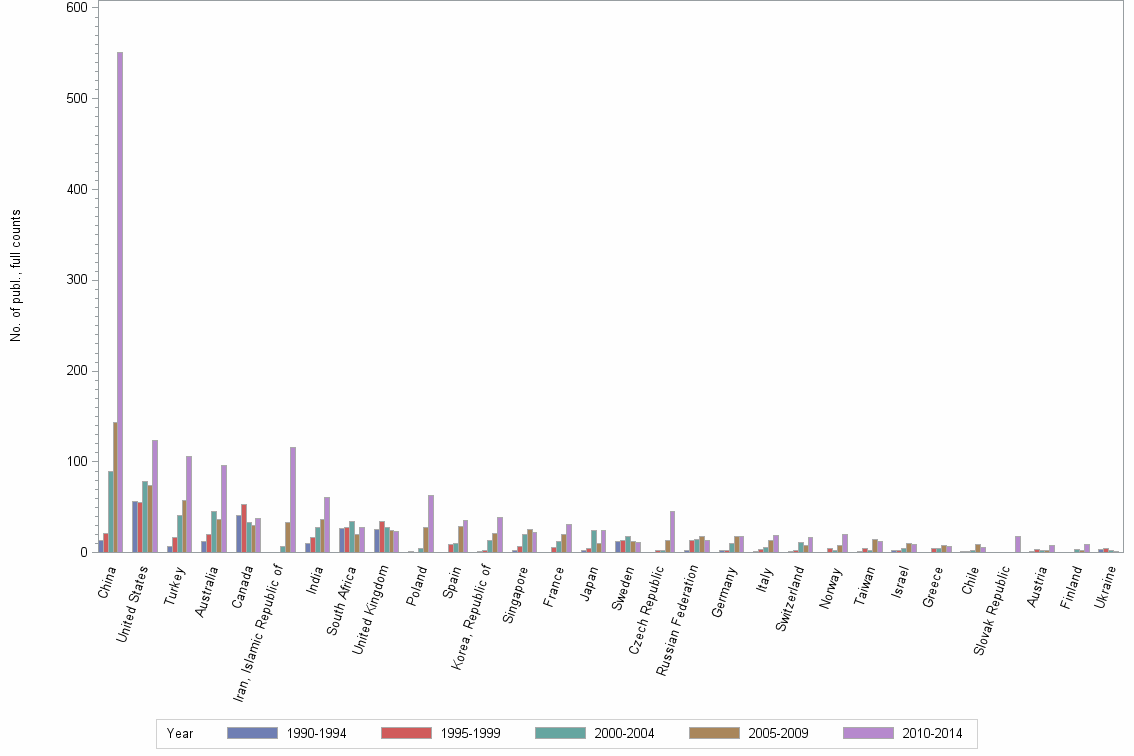
Lev3: INTERNATIONAL JOURNAL OF ROCK MECHANICS AND MINING SCIENCES//ENGINEERING, MANUFACTURING//INTERNATIONAL JOURNAL OF MACHINE TOOLS & MANUFACTURE - Statistics for Countries

Statistics per Country

Number of publications, full counts

Obs Country 1990-1994 1995-1999 2000-2004 2005-2009 2010-2014 All years
1 All countries 221 333 480 643 1339 3016
2 China 14 21 89 143 551 818
3 United States 57 55 78 74 124 388
4 Turkey 7 17 41 58 106 229
5 Australia 12 20 45 37 96 210
6 Canada 41 53 33 30 38 195
7 Iran, Islamic Republic of . . 7 33 116 156
8 India 10 17 28 37 61 153
9 South Africa 27 28 34 20 28 137
10 United Kingdom 26 34 28 25 23 136
11 Poland 1 . 5 28 63 97
12 Spain . 9 10 29 36 84
13 Korea, Republic of 1 2 14 21 39 77
14 Singapore 2 7 20 26 22 77
15 France . 6 12 20 31 69
16 Japan 3 5 25 10 25 68
17 Sweden 12 13 18 12 11 66
18 Czech Republic . 3 2 14 45 64
19 Russian Federation 2 13 15 18 14 62
20 Germany 2 3 10 18 18 51
21 Italy 1 4 6 14 19 44
22 Switzerland 1 2 11 8 17 39
23 Norway . 5 3 8 20 36
24 Taiwan 1 5 3 15 12 36
25 Israel 2 3 5 10 9 29
26 Greece . 5 5 8 7 25
27 Chile 1 1 3 9 6 20
28 Slovak Republic . . . . 18 18
29 Austria 1 4 2 2 8 17
30 Finland . . 4 2 9 15
31 Ukraine 4 5 2 1 . 12
32 Brazil . 2 2 2 4 10
33 Egypt 4 2 . 2 1 9
34 Saudi Arabia 6 1 1 . 1 9
35 Indonesia . . 2 2 4 8
36 Republic of Serbia . . . . 8 8
37 Malaysia . . . 1 6 7
38 Pakistan . . . 2 5 7
39 Romania . . . 2 5 7
40 Belgium . 2 . . 4 6
41 Croatia . . . 1 5 6
42 Netherlands 2 . 2 2 . 6
43 New Zealand 1 2 . 2 1 6
44 Portugal . . 1 2 3 6
45 Kazakhstan . 1 3 . 1 5
46 Latvia . . . 2 3 5
47 Slovenia . . 2 . 3 5
48 Algeria . . 1 2 1 4
49 Hungary 1 1 . . 1 3
50 Jordan . . 2 1 . 3
51 Kyrgyz Republic . 2 1 . . 3
52 Mexico . . . . 3 3
53 Nigeria . . . 2 1 3

Number of publications, full counts


Bar chart of publication_year

Share of the total number of publications in the field, full counts (%)

Obs Country 1990-1994 1995-1999 2000-2004 2005-2009 2010-2014 All years
1 All countries 100.0 100.0 100.0 100.0 100.0 100.0
2 China 6.3 6.3 18.5 22.2 41.2 27.1
3 United States 25.8 16.5 16.3 11.5 9.3 12.9
4 Turkey 3.2 5.1 8.5 9.0 7.9 7.6
5 Australia 5.4 6.0 9.4 5.8 7.2 7.0
6 Canada 18.6 15.9 6.9 4.7 2.8 6.5
7 Iran, Islamic Republic of . . 1.5 5.1 8.7 5.2
8 India 4.5 5.1 5.8 5.8 4.6 5.1
9 South Africa 12.2 8.4 7.1 3.1 2.1 4.5
10 United Kingdom 11.8 10.2 5.8 3.9 1.7 4.5
11 Poland 0.5 . 1.0 4.4 4.7 3.2
12 Spain . 2.7 2.1 4.5 2.7 2.8
13 Korea, Republic of 0.5 0.6 2.9 3.3 2.9 2.6
14 Singapore 0.9 2.1 4.2 4.0 1.6 2.6
15 France . 1.8 2.5 3.1 2.3 2.3
16 Japan 1.4 1.5 5.2 1.6 1.9 2.3
17 Sweden 5.4 3.9 3.8 1.9 0.8 2.2
18 Czech Republic . 0.9 0.4 2.2 3.4 2.1
19 Russian Federation 0.9 3.9 3.1 2.8 1.0 2.1
20 Germany 0.9 0.9 2.1 2.8 1.3 1.7
21 Italy 0.5 1.2 1.3 2.2 1.4 1.5
22 Switzerland 0.5 0.6 2.3 1.2 1.3 1.3
23 Norway . 1.5 0.6 1.2 1.5 1.2
24 Taiwan 0.5 1.5 0.6 2.3 0.9 1.2
25 Israel 0.9 0.9 1.0 1.6 0.7 1.0
26 Greece . 1.5 1.0 1.2 0.5 0.8
27 Chile 0.5 0.3 0.6 1.4 0.4 0.7
28 Slovak Republic . . . . 1.3 0.6
29 Austria 0.5 1.2 0.4 0.3 0.6 0.6
30 Finland . . 0.8 0.3 0.7 0.5
31 Ukraine 1.8 1.5 0.4 0.2 . 0.4
32 Brazil . 0.6 0.4 0.3 0.3 0.3
33 Egypt 1.8 0.6 . 0.3 0.1 0.3
34 Saudi Arabia 2.7 0.3 0.2 . 0.1 0.3
35 Indonesia . . 0.4 0.3 0.3 0.3
36 Republic of Serbia . . . . 0.6 0.3
37 Malaysia . . . 0.2 0.4 0.2
38 Pakistan . . . 0.3 0.4 0.2
39 Romania . . . 0.3 0.4 0.2
40 Belgium . 0.6 . . 0.3 0.2
41 Croatia . . . 0.2 0.4 0.2
42 Netherlands 0.9 . 0.4 0.3 . 0.2
43 New Zealand 0.5 0.6 . 0.3 0.1 0.2
44 Portugal . . 0.2 0.3 0.2 0.2
45 Kazakhstan . 0.3 0.6 . 0.1 0.2
46 Latvia . . . 0.3 0.2 0.2
47 Slovenia . . 0.4 . 0.2 0.2
48 Algeria . . 0.2 0.3 0.1 0.1
49 Hungary 0.5 0.3 . . 0.1 0.1
50 Jordan . . 0.4 0.2 . 0.1
51 Kyrgyz Republic . 0.6 0.2 . . 0.1
52 Mexico . . . . 0.2 0.1
53 Nigeria . . . 0.3 0.1 0.1

Share of the total number of publications in the field, full counts (%)


Bar chart of publication_year

Number of publications among 10% most cited in field, full counts

Obs Country 1990-1994 1995-1999 2000-2004 2005-2009 2010-2014 All years
1 All countries 10.5 26.3 28.6 37.2 89.8 192.4
2 China 1.5 1.5 6.9 9.1 38.2 57.1
3 United States 3.5 7.5 3.6 7.8 13.2 35.6
4 Turkey 0.0 0.5 2.9 7.3 6.0 16.7
5 Australia 0.0 2.5 0.5 2.0 9.3 14.3
6 Canada 1.5 5.8 2.0 1.1 3.4 13.8
7 Iran, Islamic Republic of . . 0.0 2.8 12.4 15.2
8 India 0.5 0.0 3.0 4.0 2.0 9.5
9 South Africa 3.0 0.0 0.5 0.0 1.2 4.7
10 United Kingdom 0.0 2.8 2.6 0.5 2.9 8.8
11 Poland 0.0 . 0.0 0.7 2.0 2.7
12 Spain . 0.5 0.0 0.5 2.5 3.5
13 Korea, Republic of 0.0 1.0 1.5 1.0 4.0 7.5
14 Singapore 0.0 0.7 0.0 4.4 3.5 8.6
15 France . 0.5 0.0 0.0 0.7 1.2
16 Japan 0.0 0.5 1.5 0.0 0.2 2.2
17 Sweden 1.5 1.5 4.1 0.0 0.0 7.1
18 Czech Republic . 0.0 0.0 0.0 2.1 2.1
19 Russian Federation 0.0 0.5 0.5 0.0 0.0 1.0
20 Germany 0.0 0.0 0.0 1.0 2.0 3.0
21 Italy 0.0 0.0 0.5 0.0 1.0 1.5
22 Switzerland 0.0 0.0 0.0 2.0 4.3 6.3
23 Norway . 0.0 0.0 1.0 2.0 3.0
24 Taiwan 0.0 1.5 0.0 1.5 2.7 5.7
25 Israel 0.5 0.5 2.0 0.7 0.5 4.2
26 Greece . 0.5 0.7 0.0 0.0 1.2
27 Chile 0.0 0.0 0.0 0.5 0.0 0.5
28 Slovak Republic . . . . 0.0 0.0
29 Austria 0.0 0.0 0.0 0.0 1.1 1.1
30 Finland . . 0.0 0.0 0.1 0.1
31 Ukraine 0.0 0.5 0.0 0.0 . 0.5
32 Brazil . 0.0 0.0 0.0 0.0 0.0
33 Egypt 0.0 0.0 . 1.0 0.0 1.0
34 Saudi Arabia 0.0 0.0 0.0 . 0.0 0.0
35 Indonesia . . 0.0 0.3 1.0 1.3
36 Republic of Serbia . . . . 0.0 0.0
37 Malaysia . . . 0.0 2.0 2.0
38 Pakistan . . . 0.0 0.0 0.0
39 Romania . . . 0.0 0.0 0.0
40 Belgium . 0.0 . . 0.8 0.8
41 Croatia . . . 0.0 0.0 0.0
42 Netherlands 0.0 . 1.0 0.0 . 1.0
43 New Zealand 0.0 0.0 . 0.0 0.0 0.0
44 Portugal . . 0.0 0.5 0.0 0.5
45 Kazakhstan . 0.0 0.0 . 0.0 0.0
46 Latvia . . . 0.0 0.0 0.0
47 Slovenia . . 0.5 . 0.0 0.5
48 Algeria . . 0.0 0.0 0.0 0.0
49 Hungary 0.0 0.0 . . 0.0 0.0
50 Jordan . . 0.0 0.0 . 0.0
51 Kyrgyz Republic . 0.0 0.0 . . 0.0
52 Mexico . . . . 0.0 0.0
53 Nigeria . . . 0.0 0.0 0.0

Number of publications among 10% most cited in field, full counts


Bar chart of publication_year

Share of publications among 10% most cited in field, fractionalized (%)

Obs Country 1990-1994 1995-1999 2000-2004 2005-2009 2010-2014 All years
1 All countries 4.8 7.9 6.0 5.8 6.7 6.4
2 China 11.9 7.0 6.6 4.5 6.4 6.2
3 United States 5.2 13.0 4.0 8.2 10.0 8.1
4 Turkey 0.0 3.4 7.5 12.2 5.5 7.6
5 Australia 0.0 13.0 1.6 5.9 7.3 6.1
6 Canada 4.0 11.5 7.7 3.0 10.6 7.9
7 Iran, Islamic Republic of . . 0.0 7.3 10.7 9.6
8 India 5.7 0.0 10.7 11.1 2.9 6.3
9 South Africa 11.3 0.0 1.6 0.0 1.7 3.0
10 United Kingdom 0.0 8.7 7.0 2.8 10.6 5.7
11 Poland 0.0 . 0.0 2.6 2.2 2.2
12 Spain . 5.8 0.0 2.0 5.4 3.6
13 Korea, Republic of 0.0 60.0 13.0 4.3 12.2 10.6
14 Singapore 0.0 9.5 0.0 20.7 13.0 10.9
15 France . 8.3 0.0 0.0 3.3 2.5
16 Japan 0.0 11.1 7.0 0.0 0.2 3.7
17 Sweden 11.6 12.0 18.8 0.0 0.0 9.4
18 Czech Republic . 0.0 0.0 0.0 3.3 2.2
19 Russian Federation 0.0 4.5 3.9 0.0 0.0 1.8
20 Germany 0.0 1.4 0.0 6.8 7.9 4.9
21 Italy 0.0 0.0 8.3 0.0 6.9 3.9
22 Switzerland 0.0 0.0 0.0 27.9 25.8 15.5
23 Norway . 0.0 0.0 13.3 13.9 10.0
24 Taiwan 0.0 22.2 0.0 7.1 22.2 14.1
25 Israel 25.0 25.0 36.8 4.2 6.7 14.8
26 Greece . 10.0 13.9 0.0 0.0 5.2
27 Chile 0.0 0.0 0.0 3.6 0.0 1.5
28 Slovak Republic . . . . 0.0 0.0
29 Austria 0.0 0.0 0.0 0.0 6.3 3.0
30 Finland . . 0.0 0.0 1.3 0.7
31 Ukraine 0.0 12.5 0.0 0.0 . 4.5
32 Brazil . 0.0 0.0 0.0 0.0 0.0
33 Egypt 0.0 0.0 . 66.7 0.0 17.9
34 Saudi Arabia 0.0 0.0 0.0 . 0.0 0.0
35 Indonesia . . 0.0 13.8 30.8 22.5
36 Republic of Serbia . . . . 0.0 0.0
37 Malaysia . . . 0.0 48.0 44.4
38 Pakistan . . . 0.0 0.0 0.0
39 Romania . . . 0.0 0.0 0.0
40 Belgium . 0.0 . . 20.0 9.1
41 Croatia . . . 0.0 0.0 0.0
42 Netherlands 0.0 . 66.7 0.0 . 24.0
43 New Zealand 0.0 0.0 . 0.0 0.0 0.0
44 Portugal . . 0.0 25.0 0.0 10.5
45 Kazakhstan . 0.0 0.0 . 0.0 0.0
46 Latvia . . . 0.0 0.0 0.0
47 Slovenia . . 25.0 . 0.0 18.0
48 Algeria . . 0.0 0.0 0.0 0.0
49 Hungary 0.0 0.0 . . 0.0 0.0
50 Jordan . . 0.0 0.0 . 0.0
51 Kyrgyz Republic . 0.0 0.0 . . 0.0
52 Mexico . . . . 0.0 0.0
53 Nigeria . . . 0.0 0.0 0.0

Share of publications among 10% most cited in field, fractionalized (%)


Bar chart of publication_year

Field normalized citation rate (cf), fractionalized

Obs Country 1990-1994 1995-1999 2000-2004 2005-2009 2010-2014 All years
1 All countries 0.70 0.82 0.75 0.76 0.80 0.78
2 China 0.77 0.70 0.69 0.64 0.81 0.76
3 United States 0.63 1.03 0.74 0.96 0.88 0.84
4 Turkey 0.50 0.49 0.96 1.22 0.90 0.96
5 Australia 0.65 1.19 0.67 0.81 0.88 0.85
6 Canada 0.65 1.21 0.75 0.77 1.02 0.92
7 Iran, Islamic Republic of . . 0.30 0.98 0.97 0.95
8 India 1.02 0.47 0.97 0.78 0.74 0.78
9 South Africa 1.39 0.25 0.47 0.26 0.43 0.57
10 United Kingdom 0.43 0.67 0.59 0.70 0.97 0.64
11 Poland 0.35 . 0.49 0.43 0.41 0.42
12 Spain . 0.66 0.51 0.68 0.61 0.63
13 Korea, Republic of 0.38 3.68 1.22 0.93 1.09 1.09
14 Singapore 0.17 0.91 0.59 1.53 1.41 1.10
15 France . 0.77 0.47 0.70 0.72 0.68
16 Japan 0.25 0.63 0.69 0.98 0.40 0.60
17 Sweden 1.30 1.39 1.59 0.57 0.33 1.09
18 Czech Republic . 0.39 0.95 0.56 0.55 0.56
19 Russian Federation 0.00 0.54 0.41 0.21 0.34 0.34
20 Germany 0.71 1.05 0.53 0.70 0.89 0.74
21 Italy 0.44 0.37 1.39 0.59 0.70 0.73
22 Switzerland 1.07 0.96 0.77 2.35 1.87 1.53
23 Norway . 0.69 0.91 0.85 1.03 0.91
24 Taiwan 0.64 1.14 0.41 0.81 1.11 0.94
25 Israel 1.12 1.39 2.52 0.91 1.05 1.33
26 Greece . 1.17 1.00 0.52 0.53 0.77
27 Chile 0.95 0.18 0.40 0.51 0.15 0.36
28 Slovak Republic . . . . 0.45 0.45
29 Austria 0.00 0.39 0.17 0.19 0.98 0.60
30 Finland . . 0.30 0.25 0.77 0.57
31 Ukraine 0.36 1.09 0.24 0.34 . 0.60
32 Brazil . 0.90 0.17 0.00 0.05 0.21
33 Egypt 0.48 0.11 . 2.71 2.19 1.25
34 Saudi Arabia 0.32 0.00 0.05 . 0.00 0.23
35 Indonesia . . 0.14 0.81 1.74 1.30
36 Republic of Serbia . . . . 0.58 0.58
37 Malaysia . . . 0.23 4.01 3.73
38 Pakistan . . . 0.35 0.38 0.37
39 Romania . . . 0.03 0.13 0.10
40 Belgium . 0.10 . . 1.20 0.60
41 Croatia . . . 0.19 0.43 0.38
42 Netherlands 0.49 . 2.69 0.75 . 1.33
43 New Zealand 1.16 0.41 . 0.05 1.37 0.59
44 Portugal . . 0.97 1.64 0.88 1.22
45 Kazakhstan . 0.00 0.24 . 0.25 0.19
46 Latvia . . . 0.00 0.00 0.00
47 Slovenia . . 1.24 . 0.06 0.91
48 Algeria . . 0.10 0.06 0.00 0.06
49 Hungary 0.16 0.95 . . 0.10 0.21
50 Jordan . . 0.11 0.06 . 0.09
51 Kyrgyz Republic . 0.00 0.38 . . 0.19
52 Mexico . . . . 0.29 0.29
53 Nigeria . . . 0.48 0.26 0.44

Field normalized citation rate (cf), fractionalized


Bar chart of publication_year