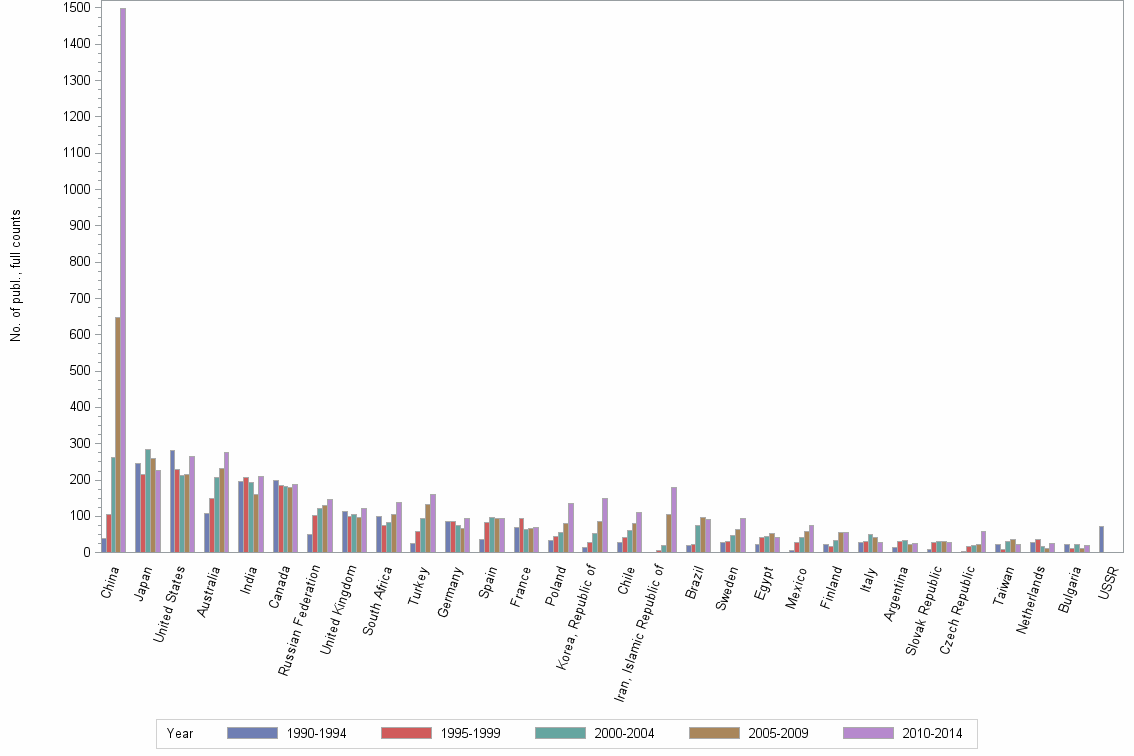
Lev3: HYDROMETALLURGY//ISIJ INTERNATIONAL//IRONMAKING & STEELMAKING - Statistics for Countries

Statistics per Country

Number of publications, full counts

Obs Country 1990-1994 1995-1999 2000-2004 2005-2009 2010-2014 All years
1 All countries 1938 2107 2521 3107 4337 14010
2 China 40 104 262 648 1499 2553
3 Japan 245 216 283 259 226 1229
4 United States 281 230 214 215 265 1205
5 Australia 109 149 207 232 275 972
6 India 196 208 193 160 211 968
7 Canada 198 184 183 180 189 934
8 Russian Federation 49 103 122 131 148 553
9 United Kingdom 113 100 105 98 122 538
10 South Africa 100 76 82 106 138 502
11 Turkey 26 59 95 133 161 474
12 Germany 86 86 75 67 94 408
13 Spain 37 84 98 94 93 406
14 France 69 94 64 67 69 363
15 Poland 35 45 56 80 135 351
16 Korea, Republic of 14 29 54 85 150 332
17 Chile 29 42 62 81 112 326
18 Iran, Islamic Republic of . 5 19 104 179 307
19 Brazil 19 24 75 96 91 305
20 Sweden 27 31 48 63 94 263
21 Egypt 24 42 46 52 43 207
22 Mexico 5 27 42 59 74 207
23 Finland 22 18 34 56 56 186
24 Italy 27 30 51 42 29 179
25 Argentina 15 31 34 23 25 128
26 Slovak Republic 8 28 32 32 28 128
27 Czech Republic 4 18 21 24 58 125
28 Taiwan 23 10 31 36 24 124
29 Netherlands 28 37 18 13 25 121
30 Bulgaria 22 13 22 12 21 90
31 USSR 73 . . . . 73
32 Greece 17 14 13 16 10 70
33 Austria 8 7 12 19 19 65
34 Republic of Serbia . . . 18 41 59
35 Romania 1 6 10 13 27 57
36 Portugal 6 10 5 11 14 46
37 Switzerland 7 16 6 5 9 43
38 Yugoslavia 4 21 14 1 . 40
39 Pakistan 5 1 1 14 18 39
40 Ukraine 2 4 9 13 11 39
41 Nigeria 3 7 5 9 12 36
42 Belgium 6 9 6 5 9 35
43 Malaysia 1 1 3 5 25 35
44 Norway 2 4 8 9 9 32
45 Colombia 1 4 1 12 11 29
46 Czechoslovakia 29 . . . . 29
47 Algeria 3 3 5 9 8 28
48 Singapore . . 10 7 10 27
49 Bangladesh 9 6 1 2 7 25
50 Saudi Arabia 1 2 2 2 18 25
51 Kazakhstan 1 2 6 6 9 24

Number of publications, full counts


Bar chart of publication_year

Share of the total number of publications in the field, full counts (%)

Obs Country 1990-1994 1995-1999 2000-2004 2005-2009 2010-2014 All years
1 All countries 100.0 100.0 100.0 100.0 100.0 100.0
2 China 2.1 4.9 10.4 20.9 34.6 18.2
3 Japan 12.6 10.3 11.2 8.3 5.2 8.8
4 United States 14.5 10.9 8.5 6.9 6.1 8.6
5 Australia 5.6 7.1 8.2 7.5 6.3 6.9
6 India 10.1 9.9 7.7 5.1 4.9 6.9
7 Canada 10.2 8.7 7.3 5.8 4.4 6.7
8 Russian Federation 2.5 4.9 4.8 4.2 3.4 3.9
9 United Kingdom 5.8 4.7 4.2 3.2 2.8 3.8
10 South Africa 5.2 3.6 3.3 3.4 3.2 3.6
11 Turkey 1.3 2.8 3.8 4.3 3.7 3.4
12 Germany 4.4 4.1 3.0 2.2 2.2 2.9
13 Spain 1.9 4.0 3.9 3.0 2.1 2.9
14 France 3.6 4.5 2.5 2.2 1.6 2.6
15 Poland 1.8 2.1 2.2 2.6 3.1 2.5
16 Korea, Republic of 0.7 1.4 2.1 2.7 3.5 2.4
17 Chile 1.5 2.0 2.5 2.6 2.6 2.3
18 Iran, Islamic Republic of . 0.2 0.8 3.3 4.1 2.2
19 Brazil 1.0 1.1 3.0 3.1 2.1 2.2
20 Sweden 1.4 1.5 1.9 2.0 2.2 1.9
21 Egypt 1.2 2.0 1.8 1.7 1.0 1.5
22 Mexico 0.3 1.3 1.7 1.9 1.7 1.5
23 Finland 1.1 0.9 1.3 1.8 1.3 1.3
24 Italy 1.4 1.4 2.0 1.4 0.7 1.3
25 Argentina 0.8 1.5 1.3 0.7 0.6 0.9
26 Slovak Republic 0.4 1.3 1.3 1.0 0.6 0.9
27 Czech Republic 0.2 0.9 0.8 0.8 1.3 0.9
28 Taiwan 1.2 0.5 1.2 1.2 0.6 0.9
29 Netherlands 1.4 1.8 0.7 0.4 0.6 0.9
30 Bulgaria 1.1 0.6 0.9 0.4 0.5 0.6
31 USSR 3.8 . . . . 0.5
32 Greece 0.9 0.7 0.5 0.5 0.2 0.5
33 Austria 0.4 0.3 0.5 0.6 0.4 0.5
34 Republic of Serbia . . . 0.6 0.9 0.4
35 Romania 0.1 0.3 0.4 0.4 0.6 0.4
36 Portugal 0.3 0.5 0.2 0.4 0.3 0.3
37 Switzerland 0.4 0.8 0.2 0.2 0.2 0.3
38 Yugoslavia 0.2 1.0 0.6 0.0 . 0.3
39 Pakistan 0.3 0.0 0.0 0.5 0.4 0.3
40 Ukraine 0.1 0.2 0.4 0.4 0.3 0.3
41 Nigeria 0.2 0.3 0.2 0.3 0.3 0.3
42 Belgium 0.3 0.4 0.2 0.2 0.2 0.2
43 Malaysia 0.1 0.0 0.1 0.2 0.6 0.2
44 Norway 0.1 0.2 0.3 0.3 0.2 0.2
45 Colombia 0.1 0.2 0.0 0.4 0.3 0.2
46 Czechoslovakia 1.5 . . . . 0.2
47 Algeria 0.2 0.1 0.2 0.3 0.2 0.2
48 Singapore . . 0.4 0.2 0.2 0.2
49 Bangladesh 0.5 0.3 0.0 0.1 0.2 0.2
50 Saudi Arabia 0.1 0.1 0.1 0.1 0.4 0.2
51 Kazakhstan 0.1 0.1 0.2 0.2 0.2 0.2

Share of the total number of publications in the field, full counts (%)


Bar chart of publication_year

Number of publications among 10% most cited in field, full counts

Obs Country 1990-1994 1995-1999 2000-2004 2005-2009 2010-2014 All years
1 All countries 191.1 167.0 228.8 254.1 270.1 1111.2
2 China 3.0 3.0 7.0 48.8 103.8 165.7
3 Japan 17.8 16.9 23.4 14.9 8.1 81.1
4 United States 43.1 21.4 25.1 19.8 22.3 131.6
5 Australia 19.9 13.0 33.5 33.6 29.8 129.8
6 India 12.8 12.8 9.0 9.5 9.8 53.9
7 Canada 28.9 20.6 19.8 22.4 13.8 105.5
8 Russian Federation 2.0 2.0 6.0 2.1 0.7 12.8
9 United Kingdom 14.7 10.9 16.5 11.6 18.0 71.7
10 South Africa 11.4 8.6 10.7 8.7 8.4 48.0
11 Turkey 4.3 4.3 10.8 15.6 5.1 40.2
12 Germany 8.7 11.4 9.0 6.3 12.5 47.9
13 Spain 10.0 8.5 12.7 11.7 7.6 50.5
14 France 2.5 4.2 7.3 9.5 8.3 31.8
15 Poland 2.0 2.0 0.0 2.7 5.8 12.5
16 Korea, Republic of 6.0 1.0 6.5 10.5 12.0 36.0
17 Chile 1.8 6.2 8.0 9.6 10.4 35.9
18 Iran, Islamic Republic of . 2.0 0.3 9.0 13.1 24.5
19 Brazil 0.0 1.0 5.2 9.1 5.9 21.1
20 Sweden 1.0 5.4 2.7 6.6 7.1 22.8
21 Egypt 2.0 4.7 4.3 5.0 2.5 18.6
22 Mexico 0.0 2.7 4.3 2.8 0.0 9.8
23 Finland 2.3 1.8 0.0 5.0 2.7 11.8
24 Italy 4.0 3.2 8.9 6.6 1.1 23.8
25 Argentina 0.5 0.0 2.7 0.5 0.7 4.4
26 Slovak Republic 1.4 4.1 4.0 5.3 1.0 15.9
27 Czech Republic 0.0 1.0 2.0 3.3 6.3 12.5
28 Taiwan 2.0 0.0 1.0 2.0 2.3 7.3
29 Netherlands 4.0 4.0 0.0 1.3 0.7 10.0
30 Bulgaria 1.0 0.3 2.0 1.0 0.0 4.3
31 USSR 0.0 . . . . 0.0
32 Greece 5.2 1.7 1.0 1.0 0.7 9.6
33 Austria 1.0 0.0 0.5 0.5 0.0 2.0
34 Republic of Serbia . . . 0.6 0.0 0.6
35 Romania 0.0 1.0 0.0 0.0 0.3 1.3
36 Portugal 1.0 1.0 1.0 1.0 0.3 4.3
37 Switzerland 0.0 2.0 0.0 0.2 0.0 2.2
38 Yugoslavia 2.1 1.0 2.0 0.0 . 5.1
39 Pakistan 0.0 0.0 0.0 0.0 2.2 2.2
40 Ukraine 0.0 0.0 0.0 0.0 0.0 0.0
41 Nigeria 0.0 1.0 0.3 0.0 0.0 1.3
42 Belgium 1.0 0.0 0.0 0.0 1.4 2.4
43 Malaysia 0.0 0.0 0.0 0.8 0.7 1.5
44 Norway 0.0 0.0 3.0 1.5 1.0 5.5
45 Colombia 0.0 0.0 0.0 4.0 0.0 4.0
46 Czechoslovakia 3.8 . . . . 3.8
47 Algeria 0.0 0.0 1.5 0.5 0.0 2.0
48 Singapore . . 1.3 3.0 2.0 6.3
49 Bangladesh 0.0 0.0 0.0 0.0 0.0 0.0
50 Saudi Arabia 0.0 0.0 0.0 0.0 3.0 3.0
51 Kazakhstan 0.0 0.0 0.0 0.0 1.3 1.3

Number of publications among 10% most cited in field, full counts


Bar chart of publication_year

Share of publications among 10% most cited in field, fractionalized (%)

Obs Country 1990-1994 1995-1999 2000-2004 2005-2009 2010-2014 All years
1 All countries 9.9 7.9 9.1 8.2 6.2 7.9
2 China 5.6 3.2 2.2 7.6 6.7 6.3
3 Japan 7.1 7.7 8.2 5.4 2.9 6.4
4 United States 15.1 8.5 13.1 8.7 8.5 11.0
5 Australia 17.8 9.2 17.1 14.1 10.0 13.4
6 India 6.7 5.9 4.9 6.1 4.0 5.5
7 Canada 13.1 10.9 12.0 11.3 7.8 11.1
8 Russian Federation 2.1 2.0 3.9 1.0 0.5 1.8
9 United Kingdom 12.4 11.6 16.5 12.7 14.0 13.4
10 South Africa 9.9 11.5 11.9 6.4 6.1 8.8
11 Turkey 11.2 7.5 11.7 10.0 3.0 7.8
12 Germany 10.1 13.8 10.0 8.5 13.1 11.2
13 Spain 24.0 9.2 13.1 10.1 7.3 11.5
14 France 3.7 3.9 14.3 10.6 9.6 7.8
15 Poland 4.5 4.7 0.0 3.5 3.8 3.3
16 Korea, Republic of 35.0 4.5 13.2 11.5 7.3 10.1
17 Chile 5.7 11.0 9.8 10.2 7.6 8.9
18 Iran, Islamic Republic of . 33.3 2.0 9.1 7.1 7.9
19 Brazil 0.0 4.8 6.9 9.9 6.9 7.3
20 Sweden 4.1 17.0 6.2 12.6 6.4 8.7
21 Egypt 8.3 11.3 9.8 10.0 6.4 9.3
22 Mexico 0.0 10.1 10.8 4.9 0.0 4.9
23 Finland 11.5 8.0 0.0 7.5 4.2 5.5
24 Italy 16.7 11.7 19.6 12.7 4.1 13.7
25 Argentina 3.3 0.0 6.1 2.4 2.9 3.0
26 Slovak Republic 11.3 16.9 13.4 15.2 2.3 11.8
27 Czech Republic 0.0 6.6 3.8 14.0 11.1 9.5
28 Taiwan 6.7 0.0 3.5 6.0 4.0 4.6
29 Netherlands 13.0 10.9 0.0 2.8 2.2 7.6
30 Bulgaria 5.1 3.0 8.2 9.6 0.0 4.9
31 USSR 0.0 . . . . 0.0
32 Greece 31.7 12.2 5.0 6.7 7.7 14.2
33 Austria 13.0 0.0 4.1 0.8 0.0 2.8
34 Republic of Serbia . . . 3.4 0.0 1.1
35 Romania 0.0 11.1 0.0 0.0 0.5 1.3
36 Portugal 10.0 10.0 25.0 5.5 2.9 8.4
37 Switzerland 0.0 14.1 0.5 4.9 0.0 6.7
38 Yugoslavia 49.4 5.1 15.7 0.0 . 12.1
39 Pakistan 0.0 0.0 0.0 0.0 11.3 4.9
40 Ukraine 0.0 0.0 0.0 0.0 0.0 0.0
41 Nigeria 0.0 15.8 6.7 0.0 0.0 4.5
42 Belgium 16.7 0.0 0.0 0.0 19.8 7.6
43 Malaysia 0.0 0.0 0.0 15.1 4.2 5.6
44 Norway 0.0 0.0 22.9 24.6 14.3 15.2
45 Colombia 0.0 0.0 0.0 25.8 0.0 10.0
46 Czechoslovakia 10.9 . . . . 10.9
47 Algeria 0.0 0.0 22.7 5.6 0.0 5.5
48 Singapore . . 13.0 47.4 19.5 26.4
49 Bangladesh 0.0 0.0 0.0 0.0 0.2 0.1
50 Saudi Arabia 0.0 0.0 0.0 0.0 19.7 11.6
51 Kazakhstan 0.0 0.0 0.0 0.0 15.3 6.3

Share of publications among 10% most cited in field, fractionalized (%)


Bar chart of publication_year

Field normalized citation rate (cf), fractionalized

Obs Country 1990-1994 1995-1999 2000-2004 2005-2009 2010-2014 All years
1 All countries 0.96 0.86 0.92 0.90 0.80 0.87
2 China 0.62 0.46 0.46 0.89 0.85 0.80
3 Japan 0.84 0.90 0.88 0.72 0.67 0.81
4 United States 1.34 0.90 1.20 1.02 1.01 1.10
5 Australia 1.39 1.01 1.42 1.29 1.08 1.23
6 India 0.78 0.67 0.63 0.70 0.62 0.68
7 Canada 1.26 1.24 1.08 1.16 0.98 1.15
8 Russian Federation 0.24 0.24 0.31 0.20 0.25 0.25
9 United Kingdom 1.10 1.18 1.41 1.19 1.17 1.21
10 South Africa 1.15 1.03 1.15 0.89 0.81 0.99
11 Turkey 1.21 0.92 1.04 0.94 0.53 0.84
12 Germany 0.87 1.13 1.51 0.93 1.23 1.13
13 Spain 1.55 0.92 1.02 1.11 0.68 1.00
14 France 0.64 0.73 1.19 1.09 0.98 0.90
15 Poland 0.57 0.51 0.43 0.60 0.76 0.62
16 Korea, Republic of 2.02 0.94 0.88 1.17 0.84 0.98
17 Chile 0.68 1.12 0.85 1.22 0.78 0.94
18 Iran, Islamic Republic of . 2.38 0.60 1.00 0.85 0.91
19 Brazil 0.53 0.83 0.88 0.92 0.78 0.83
20 Sweden 0.89 1.12 1.01 1.21 0.90 1.01
21 Egypt 0.77 0.96 1.09 0.91 0.67 0.90
22 Mexico 0.43 0.95 1.15 0.82 0.45 0.76
23 Finland 0.97 0.89 0.70 0.90 0.74 0.82
24 Italy 1.45 1.42 1.55 1.19 0.81 1.31
25 Argentina 0.60 0.56 0.62 0.43 0.50 0.55
26 Slovak Republic 0.77 1.10 0.96 1.05 0.68 0.93
27 Czech Republic 0.44 0.55 0.83 1.36 0.93 0.93
28 Taiwan 0.92 0.64 0.70 0.69 0.67 0.73
29 Netherlands 1.22 0.95 0.52 0.53 0.70 0.87
30 Bulgaria 0.74 0.97 1.00 0.64 0.30 0.71
31 USSR 0.08 . . . . 0.08
32 Greece 1.59 0.99 0.82 0.58 1.00 1.03
33 Austria 1.27 0.51 0.82 0.60 0.47 0.69
34 Republic of Serbia . . . 0.65 0.35 0.45
35 Romania 0.34 0.76 0.13 0.09 0.42 0.32
36 Portugal 1.08 1.42 1.52 0.81 0.66 1.03
37 Switzerland 0.22 1.16 1.12 1.13 0.74 0.91
38 Yugoslavia 2.14 0.64 1.01 0.24 . 0.87
39 Pakistan 0.24 0.26 0.34 0.18 0.74 0.44
40 Ukraine 0.00 0.02 0.09 0.21 0.18 0.14
41 Nigeria 0.00 0.87 0.80 1.27 0.59 0.75
42 Belgium 2.34 0.86 0.43 0.92 1.44 1.21
43 Malaysia 1.44 0.18 0.65 1.06 0.65 0.72
44 Norway 0.80 0.29 1.30 1.29 1.42 1.13
45 Colombia 0.40 0.29 0.81 2.41 0.31 1.13
46 Czechoslovakia 0.71 . . . . 0.71
47 Algeria 0.35 0.50 1.48 0.56 0.34 0.61
48 Singapore . . 1.34 1.78 1.47 1.53
49 Bangladesh 0.52 0.23 0.25 0.81 0.30 0.40
50 Saudi Arabia 1.14 0.79 0.32 1.02 1.85 1.42
51 Kazakhstan 0.27 0.08 0.64 0.16 0.86 0.56

Field normalized citation rate (cf), fractionalized


Bar chart of publication_year