Lev2: GEOKHIMIYA//SULFOSALT//DOKLADY EARTH SCIENCES - Statistics for Countries

Statistics per Country

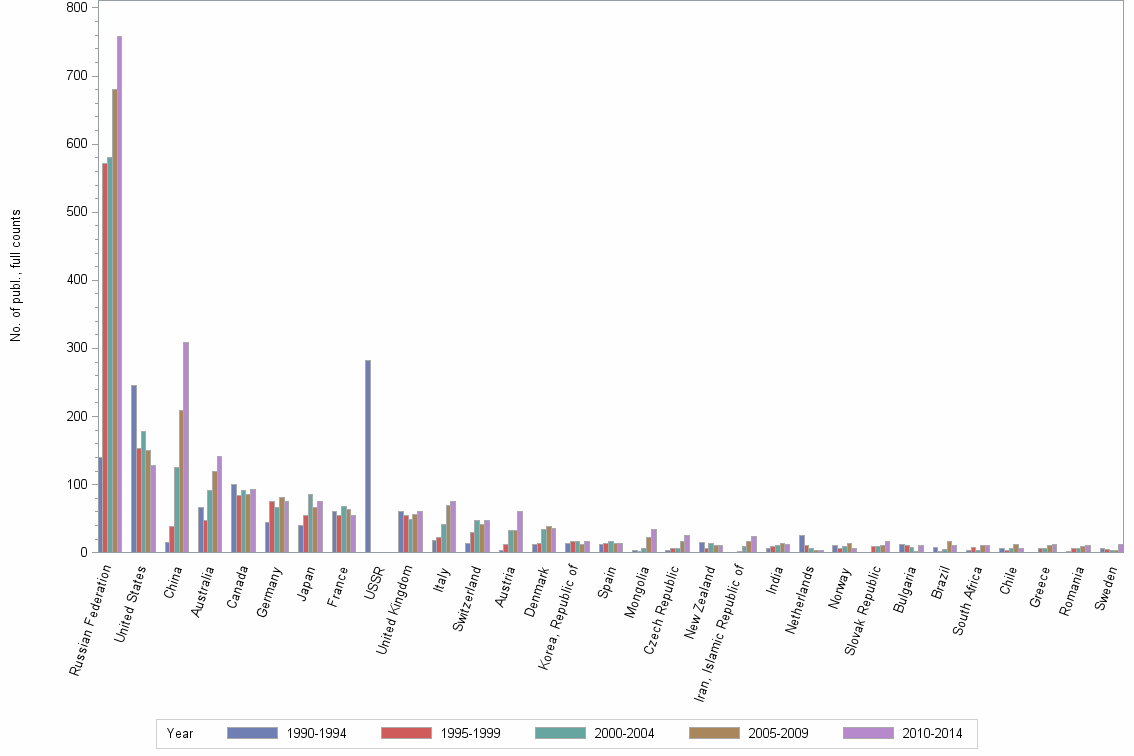
Number of publications, full counts

Obs Country 1990-1994 1995-1999 2000-2004 2005-2009 2010-2014 All years
1 All countries 1117 1169 1366 1489 1644 6785
2 Russian Federation 140 571 581 680 758 2730
3 United States 246 153 178 150 128 855
4 China 15 38 125 209 309 696
5 Australia 67 48 91 120 141 467
6 Canada 100 84 92 86 93 455
7 Germany 44 75 67 81 75 342
8 Japan 40 54 85 66 75 320
9 France 61 54 68 64 55 302
10 USSR 282 . . . . 282
11 United Kingdom 61 55 49 56 60 281
12 Italy 18 23 41 70 75 227
13 Switzerland 13 30 48 41 48 180
14 Austria 4 12 33 32 60 141
15 Denmark 12 13 34 38 35 132
16 Korea, Republic of 13 16 17 12 17 75
17 Spain 12 13 17 13 14 69
18 Mongolia 3 2 6 23 34 68
19 Czech Republic 3 7 7 16 26 59
20 New Zealand 15 7 13 11 11 57
21 Iran, Islamic Republic of 1 2 9 17 24 53
22 India 6 9 10 14 12 51
23 Netherlands 25 11 7 4 4 51
24 Norway 10 7 9 14 7 47
25 Slovak Republic . 9 9 11 16 45
26 Bulgaria 12 10 8 2 11 43
27 Brazil 8 2 5 16 10 41
28 South Africa 4 8 4 10 11 37
29 Chile 6 3 7 12 7 35
30 Greece . 7 6 10 12 35
31 Romania 2 6 7 9 11 35
32 Indonesia 11 4 4 12 3 34
33 Poland . 3 3 9 19 34
34 Ukraine 6 13 7 4 4 34
35 Turkey 1 . 6 10 16 33
36 Sweden 6 5 3 4 12 30
37 Argentina 3 2 5 6 13 29
38 Taiwan . 1 1 8 13 23
39 Kazakhstan . 2 2 4 12 20
40 Mexico 1 2 9 4 3 19
41 Portugal 1 4 5 2 7 19
42 Philippines 3 1 2 7 3 16
43 Finland 4 2 3 1 5 15
44 Belgium 2 . 4 2 6 14
45 Macedonia . 2 . 6 6 14
46 Republic of Serbia . . . 6 8 14
47 Hungary 1 5 1 3 3 13
48 Israel 3 1 2 2 5 13
49 Peru 2 . 3 5 3 13
50 Egypt . 2 2 2 5 11
51 Bolivia 6 3 1 . . 10

Number of publications, full counts


Bar chart of publication_year

Share of the total number of publications in the field, full counts (%)

Obs Country 1990-1994 1995-1999 2000-2004 2005-2009 2010-2014 All years
1 All countries 100.0 100.0 100.0 100.0 100.0 100.0
2 Russian Federation 12.5 48.8 42.5 45.7 46.1 40.2
3 United States 22.0 13.1 13.0 10.1 7.8 12.6
4 China 1.3 3.3 9.2 14.0 18.8 10.3
5 Australia 6.0 4.1 6.7 8.1 8.6 6.9
6 Canada 9.0 7.2 6.7 5.8 5.7 6.7
7 Germany 3.9 6.4 4.9 5.4 4.6 5.0
8 Japan 3.6 4.6 6.2 4.4 4.6 4.7
9 France 5.5 4.6 5.0 4.3 3.3 4.5
10 USSR 25.2 . . . . 4.2
11 United Kingdom 5.5 4.7 3.6 3.8 3.6 4.1
12 Italy 1.6 2.0 3.0 4.7 4.6 3.3
13 Switzerland 1.2 2.6 3.5 2.8 2.9 2.7
14 Austria 0.4 1.0 2.4 2.1 3.6 2.1
15 Denmark 1.1 1.1 2.5 2.6 2.1 1.9
16 Korea, Republic of 1.2 1.4 1.2 0.8 1.0 1.1
17 Spain 1.1 1.1 1.2 0.9 0.9 1.0
18 Mongolia 0.3 0.2 0.4 1.5 2.1 1.0
19 Czech Republic 0.3 0.6 0.5 1.1 1.6 0.9
20 New Zealand 1.3 0.6 1.0 0.7 0.7 0.8
21 Iran, Islamic Republic of 0.1 0.2 0.7 1.1 1.5 0.8
22 India 0.5 0.8 0.7 0.9 0.7 0.8
23 Netherlands 2.2 0.9 0.5 0.3 0.2 0.8
24 Norway 0.9 0.6 0.7 0.9 0.4 0.7
25 Slovak Republic . 0.8 0.7 0.7 1.0 0.7
26 Bulgaria 1.1 0.9 0.6 0.1 0.7 0.6
27 Brazil 0.7 0.2 0.4 1.1 0.6 0.6
28 South Africa 0.4 0.7 0.3 0.7 0.7 0.5
29 Chile 0.5 0.3 0.5 0.8 0.4 0.5
30 Greece . 0.6 0.4 0.7 0.7 0.5
31 Romania 0.2 0.5 0.5 0.6 0.7 0.5
32 Indonesia 1.0 0.3 0.3 0.8 0.2 0.5
33 Poland . 0.3 0.2 0.6 1.2 0.5
34 Ukraine 0.5 1.1 0.5 0.3 0.2 0.5
35 Turkey 0.1 . 0.4 0.7 1.0 0.5
36 Sweden 0.5 0.4 0.2 0.3 0.7 0.4
37 Argentina 0.3 0.2 0.4 0.4 0.8 0.4
38 Taiwan . 0.1 0.1 0.5 0.8 0.3
39 Kazakhstan . 0.2 0.1 0.3 0.7 0.3
40 Mexico 0.1 0.2 0.7 0.3 0.2 0.3
41 Portugal 0.1 0.3 0.4 0.1 0.4 0.3
42 Philippines 0.3 0.1 0.1 0.5 0.2 0.2
43 Finland 0.4 0.2 0.2 0.1 0.3 0.2
44 Belgium 0.2 . 0.3 0.1 0.4 0.2
45 Macedonia . 0.2 . 0.4 0.4 0.2
46 Republic of Serbia . . . 0.4 0.5 0.2
47 Hungary 0.1 0.4 0.1 0.2 0.2 0.2
48 Israel 0.3 0.1 0.1 0.1 0.3 0.2
49 Peru 0.2 . 0.2 0.3 0.2 0.2
50 Egypt . 0.2 0.1 0.1 0.3 0.2
51 Bolivia 0.5 0.3 0.1 . . 0.1

Share of the total number of publications in the field, full counts (%)


Bar chart of publication_year

Number of publications among 10% most cited in field, full counts

Obs Country 1990-1994 1995-1999 2000-2004 2005-2009 2010-2014 All years
1 All countries 85.0 61.4 56.3 79.5 124.8 407.1
2 Russian Federation 4.0 11.7 13.7 15.1 22.8 67.3
3 United States 41.5 21.3 17.5 15.7 25.6 121.7
4 China 0.0 2.0 5.0 22.5 46.0 75.5
5 Australia 7.4 7.0 12.5 27.2 31.1 85.2
6 Canada 9.0 12.7 8.5 12.7 16.5 59.3
7 Germany 3.0 3.0 7.0 7.0 11.1 31.1
8 Japan 5.0 2.7 4.0 4.4 11.2 27.2
9 France 3.4 3.7 4.5 4.4 9.9 25.8
10 USSR 10.7 . . . . 10.7
11 United Kingdom 4.8 1.0 5.0 4.5 10.7 26.0
12 Italy 0.0 0.5 0.5 2.0 3.9 6.9
13 Switzerland 2.0 6.5 5.5 12.3 11.7 38.0
14 Austria 0.0 0.0 2.0 2.0 2.0 6.0
15 Denmark 1.0 1.0 0.0 1.5 1.3 4.8
16 Korea, Republic of 0.0 0.0 0.0 0.0 1.0 1.0
17 Spain 0.0 0.0 1.0 0.5 0.0 1.5
18 Mongolia 0.0 0.0 2.0 4.0 2.6 8.6
19 Czech Republic 0.0 1.0 0.0 0.5 3.0 4.5
20 New Zealand 1.0 0.7 1.0 2.0 1.0 5.7
21 Iran, Islamic Republic of 0.0 0.0 0.0 0.0 0.4 0.4
22 India 0.0 0.0 0.0 0.0 0.1 0.1
23 Netherlands 4.5 0.0 1.5 0.0 0.0 6.0
24 Norway 0.0 0.0 1.7 3.9 1.2 6.8
25 Slovak Republic . 0.0 0.0 0.0 0.0 0.0
26 Bulgaria 0.0 0.0 0.0 0.0 0.0 0.0
27 Brazil 0.0 0.0 0.0 0.0 0.0 0.0
28 South Africa 0.0 0.0 0.5 0.0 0.1 0.6
29 Chile 0.0 0.0 0.0 2.0 3.0 5.0
30 Greece . 0.0 0.0 0.0 0.0 0.0
31 Romania 0.0 0.0 0.0 0.5 0.0 0.5
32 Indonesia 0.0 1.0 0.0 0.0 0.0 1.0
33 Poland . 0.0 0.0 0.0 0.0 0.0
34 Ukraine 0.0 0.0 0.0 0.0 0.0 0.0
35 Turkey 0.0 . 0.0 0.0 0.1 0.1
36 Sweden 0.5 0.0 0.0 0.0 2.3 2.8
37 Argentina 0.0 0.0 0.0 0.0 0.0 0.0
38 Taiwan . 0.0 0.0 0.0 2.1 2.1
39 Kazakhstan . 0.0 0.0 0.0 0.0 0.0
40 Mexico 0.0 0.0 0.0 0.0 0.0 0.0
41 Portugal 0.0 0.0 0.0 0.0 0.0 0.0
42 Philippines 1.0 1.0 0.0 0.0 0.0 2.0
43 Finland 0.0 0.0 0.0 0.0 0.0 0.0
44 Belgium 0.0 . 1.0 0.0 1.0 2.0
45 Macedonia . 0.0 . 0.0 0.0 0.0
46 Republic of Serbia . . . 0.0 0.5 0.5
47 Hungary 0.0 0.0 0.0 0.0 0.0 0.0
48 Israel 0.0 0.0 1.0 0.0 1.0 2.0
49 Peru 0.0 . 0.0 0.0 0.0 0.0
50 Egypt . 0.0 0.0 0.0 0.0 0.0
51 Bolivia 0.0 0.0 0.0 . . 0.0

Number of publications among 10% most cited in field, full counts


Bar chart of publication_year

Share of publications among 10% most cited in field, fractionalized (%)

Obs Country 1990-1994 1995-1999 2000-2004 2005-2009 2010-2014 All years
1 All countries 7.6 5.3 4.1 5.3 7.6 6.0
2 Russian Federation 2.6 1.9 1.9 1.3 2.0 1.8
3 United States 17.0 13.7 7.3 9.9 19.5 13.6
4 China 0.0 5.9 3.2 8.6 12.8 9.1
5 Australia 12.8 15.1 11.9 17.9 19.4 15.8
6 Canada 8.4 15.3 6.8 11.4 20.6 12.1
7 Germany 6.1 3.8 7.2 5.1 13.2 6.7
8 Japan 11.9 3.9 2.0 4.8 10.5 6.0
9 France 4.6 6.0 4.7 8.0 17.8 7.2
10 USSR 3.5 . . . . 3.5
11 United Kingdom 8.2 1.3 8.6 10.4 17.8 8.4
12 Italy 0.0 2.8 1.6 1.2 6.1 2.9
13 Switzerland 15.7 26.9 11.9 35.6 30.4 24.6
14 Austria 0.0 0.0 11.7 6.1 1.3 4.7
15 Denmark 10.2 10.5 0.0 1.4 4.1 3.5
16 Korea, Republic of 0.0 0.0 0.0 0.0 1.0 0.2
17 Spain 0.0 0.0 3.7 1.8 0.0 1.4
18 Mongolia 0.0 0.0 24.3 14.1 3.7 9.4
19 Czech Republic 0.0 10.8 0.0 1.8 6.9 4.3
20 New Zealand 11.6 2.4 9.2 21.8 4.8 10.8
21 Iran, Islamic Republic of 0.0 0.0 0.0 0.0 2.1 1.0
22 India 0.0 0.0 0.0 0.0 0.3 0.1
23 Netherlands 20.3 0.0 31.0 0.0 0.0 16.0
24 Norway 0.0 0.0 22.5 24.9 16.9 11.2
25 Slovak Republic . 0.0 0.0 0.0 0.0 0.0
26 Bulgaria 0.0 0.0 0.0 0.0 0.0 0.0
27 Brazil 0.0 0.0 0.0 0.0 0.0 0.0
28 South Africa 0.0 0.0 15.0 0.0 0.4 2.2
29 Chile 0.0 0.0 0.0 16.4 37.9 9.2
30 Greece . 0.0 0.0 0.0 0.0 0.0
31 Romania 0.0 0.0 0.0 3.0 0.0 0.7
32 Indonesia 0.0 21.4 0.0 0.0 0.0 2.8
33 Poland . 0.0 0.0 0.0 0.0 0.0
34 Ukraine 0.0 0.0 0.0 0.0 0.0 0.0
35 Turkey 0.0 . 0.0 0.0 0.3 0.2
36 Sweden 10.0 0.0 0.0 0.0 9.1 6.2
37 Argentina 0.0 0.0 0.0 0.0 0.0 0.0
38 Taiwan . 0.0 0.0 0.0 10.1 5.4
39 Kazakhstan . 0.0 0.0 0.0 0.0 0.0
40 Mexico 0.0 0.0 0.0 0.0 0.0 0.0
41 Portugal 0.0 0.0 0.0 0.0 0.0 0.0
42 Philippines 44.4 100.0 0.0 0.0 0.0 13.7
43 Finland 0.0 0.0 0.0 0.0 0.0 0.0
44 Belgium 0.0 . 18.2 0.0 25.5 15.9
45 Macedonia . 0.0 . 0.0 0.0 0.0
46 Republic of Serbia . . . 0.0 2.9 1.7
47 Hungary 0.0 0.0 0.0 0.0 0.0 0.0
48 Israel 0.0 0.0 54.5 0.0 15.8 9.7
49 Peru 0.0 . 0.0 0.0 0.0 0.0
50 Egypt . 0.0 0.0 0.0 0.0 0.0
51 Bolivia 0.0 0.0 0.0 . . 0.0

Share of publications among 10% most cited in field, fractionalized (%)


Bar chart of publication_year

Field normalized citation rate (cf), fractionalized

Obs Country 1990-1994 1995-1999 2000-2004 2005-2009 2010-2014 All years
1 All countries 0.67 0.55 0.60 0.62 0.76 0.65
2 Russian Federation 0.15 0.18 0.32 0.29 0.30 0.27
3 United States 1.32 1.20 0.94 0.97 1.54 1.19
4 China 0.19 0.53 0.58 0.97 1.25 0.98
5 Australia 1.02 1.80 1.55 1.45 1.60 1.48
6 Canada 1.00 1.19 1.04 1.22 1.35 1.14
7 Germany 0.73 0.64 0.79 0.65 1.16 0.77
8 Japan 0.91 0.39 0.46 0.61 0.96 0.64
9 France 0.77 0.82 0.70 0.88 1.29 0.85
10 USSR 0.19 . . . . 0.19
11 United Kingdom 0.98 0.56 0.97 0.93 2.69 1.11
12 Italy 0.47 0.47 0.52 0.59 0.70 0.59
13 Switzerland 1.11 2.26 1.26 1.79 1.97 1.72
14 Austria 0.42 0.37 1.24 0.74 0.46 0.70
15 Denmark 0.75 1.77 0.54 0.60 0.56 0.72
16 Korea, Republic of 0.27 0.18 0.19 0.20 0.36 0.23
17 Spain 0.17 0.31 0.46 0.48 0.40 0.37
18 Mongolia 0.05 0.47 1.37 1.15 0.63 0.85
19 Czech Republic 0.51 0.82 0.68 0.38 0.69 0.60
20 New Zealand 1.38 0.63 0.91 0.87 0.65 0.92
21 Iran, Islamic Republic of 0.18 0.16 0.63 0.34 0.38 0.40
22 India 0.10 0.20 0.33 0.23 0.30 0.24
23 Netherlands 1.25 0.44 2.13 0.68 0.53 1.16
24 Norway 0.80 0.66 1.35 1.78 1.31 1.11
25 Slovak Republic . 0.13 0.25 0.33 0.34 0.27
26 Bulgaria 0.09 0.23 0.56 0.29 0.21 0.23
27 Brazil 0.24 0.44 0.30 0.31 0.40 0.33
28 South Africa 0.18 0.28 0.86 0.38 0.88 0.52
29 Chile 0.54 0.71 0.48 1.47 2.45 1.04
30 Greece . 0.29 0.39 0.76 0.60 0.52
31 Romania 0.59 0.34 0.25 0.46 0.32 0.35
32 Indonesia 0.58 0.76 0.73 0.21 0.08 0.48
33 Poland . 0.11 0.35 0.44 0.32 0.34
34 Ukraine 0.30 0.15 0.00 0.11 0.34 0.16
35 Turkey 0.04 . 0.14 0.27 0.50 0.35
36 Sweden 0.95 0.43 0.58 0.92 0.61 0.70
37 Argentina 0.13 0.12 0.21 0.28 0.33 0.25
38 Taiwan . 0.59 0.26 0.61 0.56 0.58
39 Kazakhstan . 0.14 0.74 0.54 0.22 0.32
40 Mexico 0.12 0.02 0.14 0.16 0.43 0.19
41 Portugal 1.45 0.21 0.58 0.64 0.23 0.36
42 Philippines 3.86 4.23 0.58 0.14 1.60 1.37
43 Finland 0.10 0.26 0.15 1.43 1.16 0.32
44 Belgium 0.12 . 0.80 0.63 2.35 1.32
45 Macedonia . 0.07 . 0.49 0.27 0.33
46 Republic of Serbia . . . 0.28 0.31 0.30
47 Hungary 0.44 0.17 0.09 0.36 0.08 0.20
48 Israel 0.70 0.07 2.18 0.17 1.65 1.00
49 Peru 0.13 . 0.38 0.46 0.43 0.37
50 Egypt . 0.40 0.29 0.72 0.02 0.24
51 Bolivia 0.40 0.62 0.73 . . 0.48

Field normalized citation rate (cf), fractionalized


Bar chart of publication_year