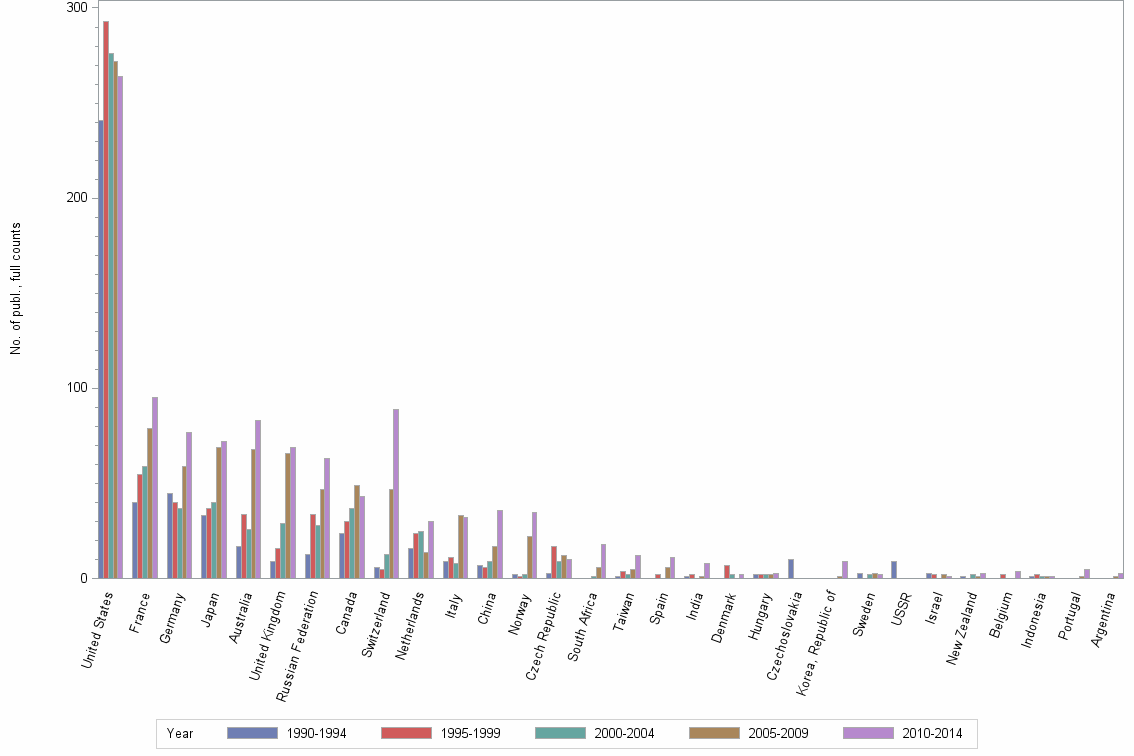
Lev1: MANTLE CONVECTION//CORE MANTLE BOUNDARY//THERMOCHEMICAL CONVECTION - Statistics for Countries

Statistics per Country

Number of publications, full counts

Obs Country 1990-1994 1995-1999 2000-2004 2005-2009 2010-2014 All years
1 All countries 415 490 482 604 683 2674
2 United States 241 293 276 272 264 1346
3 France 40 55 59 79 95 328
4 Germany 45 40 37 59 77 258
5 Japan 33 37 40 69 72 251
6 Australia 17 34 26 68 83 228
7 United Kingdom 9 16 29 66 69 189
8 Russian Federation 13 34 28 47 63 185
9 Canada 24 30 37 49 43 183
10 Switzerland 6 5 13 47 89 160
11 Netherlands 16 24 25 14 30 109
12 Italy 9 11 8 33 32 93
13 China 7 6 9 17 36 75
14 Norway 2 1 2 22 35 62
15 Czech Republic 3 17 9 12 10 51
16 South Africa . . 1 6 18 25
17 Taiwan 1 4 2 5 12 24
18 Spain . 2 . 6 11 19
19 India 1 2 . 1 8 12
20 Denmark . 7 2 . 2 11
21 Hungary 2 2 2 2 3 11
22 Czechoslovakia 10 . . . . 10
23 Korea, Republic of . . . 1 9 10
24 Sweden 3 . 2 3 2 10
25 USSR 9 . . . . 9
26 Israel 3 2 . 2 1 8
27 New Zealand 1 . 2 1 3 7
28 Belgium . 2 . . 4 6
29 Indonesia 1 2 1 1 1 6
30 Portugal . . . 1 5 6
31 Argentina . . . 1 3 4
32 Brazil . . 1 . 2 3
33 Chile . 1 1 . 1 3
34 French Polynesia . . . 2 . 2
35 Iran, Islamic Republic of . . 2 . . 2
36 Ireland . 1 . . 1 2
37 Romania . . . . 2 2
38 Azerbaijan . . 1 . . 1
39 Finland . . . . 1 1
40 Mexico . . . . 1 1
41 Saudi Arabia . . . . 1 1
42 Turkey . 1 . . . 1
43 Ukraine . . . . 1 1
44 Viet Nam . . . 1 . 1

Number of publications, full counts


Bar chart of publication_year

Share of the total number of publications in the field, full counts (%)

Obs Country 1990-1994 1995-1999 2000-2004 2005-2009 2010-2014 All years
1 All countries 100.0 100.0 100.0 100.0 100.0 100.0
2 United States 58.1 59.8 57.3 45.0 38.7 50.3
3 France 9.6 11.2 12.2 13.1 13.9 12.3
4 Germany 10.8 8.2 7.7 9.8 11.3 9.6
5 Japan 8.0 7.6 8.3 11.4 10.5 9.4
6 Australia 4.1 6.9 5.4 11.3 12.2 8.5
7 United Kingdom 2.2 3.3 6.0 10.9 10.1 7.1
8 Russian Federation 3.1 6.9 5.8 7.8 9.2 6.9
9 Canada 5.8 6.1 7.7 8.1 6.3 6.8
10 Switzerland 1.4 1.0 2.7 7.8 13.0 6.0
11 Netherlands 3.9 4.9 5.2 2.3 4.4 4.1
12 Italy 2.2 2.2 1.7 5.5 4.7 3.5
13 China 1.7 1.2 1.9 2.8 5.3 2.8
14 Norway 0.5 0.2 0.4 3.6 5.1 2.3
15 Czech Republic 0.7 3.5 1.9 2.0 1.5 1.9
16 South Africa . . 0.2 1.0 2.6 0.9
17 Taiwan 0.2 0.8 0.4 0.8 1.8 0.9
18 Spain . 0.4 . 1.0 1.6 0.7
19 India 0.2 0.4 . 0.2 1.2 0.4
20 Denmark . 1.4 0.4 . 0.3 0.4
21 Hungary 0.5 0.4 0.4 0.3 0.4 0.4
22 Czechoslovakia 2.4 . . . . 0.4
23 Korea, Republic of . . . 0.2 1.3 0.4
24 Sweden 0.7 . 0.4 0.5 0.3 0.4
25 USSR 2.2 . . . . 0.3
26 Israel 0.7 0.4 . 0.3 0.1 0.3
27 New Zealand 0.2 . 0.4 0.2 0.4 0.3
28 Belgium . 0.4 . . 0.6 0.2
29 Indonesia 0.2 0.4 0.2 0.2 0.1 0.2
30 Portugal . . . 0.2 0.7 0.2
31 Argentina . . . 0.2 0.4 0.1
32 Brazil . . 0.2 . 0.3 0.1
33 Chile . 0.2 0.2 . 0.1 0.1
34 French Polynesia . . . 0.3 . 0.1
35 Iran, Islamic Republic of . . 0.4 . . 0.1
36 Ireland . 0.2 . . 0.1 0.1
37 Romania . . . . 0.3 0.1
38 Azerbaijan . . 0.2 . . 0.0
39 Finland . . . . 0.1 0.0
40 Mexico . . . . 0.1 0.0
41 Saudi Arabia . . . . 0.1 0.0
42 Turkey . 0.2 . . . 0.0
43 Ukraine . . . . 0.1 0.0
44 Viet Nam . . . 0.2 . 0.0

Share of the total number of publications in the field, full counts (%)


Bar chart of publication_year

Number of publications among 10% most cited in field, full counts

Obs Country 1990-1994 1995-1999 2000-2004 2005-2009 2010-2014 All years
1 All countries 72.3 88.6 77.3 105.4 98.5 442.0
2 United States 46.6 65.4 50.7 62.5 56.0 281.2
3 France 6.3 11.5 6.0 17.6 17.9 59.3
4 Germany 7.5 8.0 5.0 6.5 14.0 41.0
5 Japan 7.0 0.5 4.0 4.0 4.0 19.5
6 Australia 7.6 14.0 9.5 16.7 20.4 68.1
7 United Kingdom 1.0 2.5 2.0 11.0 14.0 30.5
8 Russian Federation 0.0 1.0 3.0 3.4 5.2 12.5
9 Canada 5.3 2.0 7.0 9.0 6.0 29.3
10 Switzerland 0.0 1.0 4.1 13.4 23.2 41.7
11 Netherlands 1.5 5.3 4.0 2.0 5.1 17.8
12 Italy 1.0 1.0 1.1 9.8 5.0 17.9
13 China 1.0 0.0 0.0 0.4 2.7 4.1
14 Norway 0.0 0.0 1.0 10.3 10.1 21.3
15 Czech Republic 0.0 0.0 1.0 0.0 0.0 1.0
16 South Africa . . 1.0 5.3 8.0 14.3
17 Taiwan 1.0 0.0 1.0 0.0 1.0 3.0
18 Spain . 0.0 . 0.0 0.5 0.5
19 India 0.0 0.0 . 0.0 0.0 0.0
20 Denmark . 0.0 0.0 . 1.0 1.0
21 Hungary 0.0 0.0 0.0 0.0 0.0 0.0
22 Czechoslovakia 0.0 . . . . 0.0
23 Korea, Republic of . . . 0.0 0.0 0.0
24 Sweden 0.0 . 0.0 0.0 0.2 0.2
25 USSR 0.0 . . . . 0.0
26 Israel 2.0 0.0 . 0.0 0.0 2.0
27 New Zealand 0.0 . 1.0 1.0 0.0 2.0
28 Belgium . 1.0 . . 0.0 1.0
29 Indonesia 0.0 0.0 1.0 0.0 0.0 1.0
30 Portugal . . . 1.0 0.0 1.0
31 Argentina . . . 0.0 0.0 0.0
32 Brazil . . 0.0 . 0.0 0.0
33 Chile . 0.0 0.0 . 0.0 0.0
34 French Polynesia . . . 0.0 . 0.0
35 Iran, Islamic Republic of . . 0.0 . . 0.0
36 Ireland . 0.0 . . 0.0 0.0
37 Romania . . . . 0.0 0.0
38 Azerbaijan . . 0.0 . . 0.0
39 Finland . . . . 0.0 0.0
40 Mexico . . . . 0.0 0.0
41 Saudi Arabia . . . . 0.0 0.0
42 Turkey . 0.0 . . . 0.0
43 Ukraine . . . . 0.0 0.0
44 Viet Nam . . . 0.0 . 0.0

Number of publications among 10% most cited in field, full counts


Bar chart of publication_year

Share of publications among 10% most cited in field, fractionalized (%)

Obs Country 1990-1994 1995-1999 2000-2004 2005-2009 2010-2014 All years
1 All countries 17.4 18.1 16.0 17.4 14.4 16.5
2 United States 19.3 22.5 18.3 22.4 19.3 20.4
3 France 15.7 19.4 9.8 21.5 15.2 16.3
4 Germany 17.3 21.5 11.7 10.3 12.0 14.4
5 Japan 17.1 0.8 9.0 6.2 4.8 6.9
6 Australia 45.4 40.2 37.7 20.9 21.0 28.2
7 United Kingdom 5.0 10.6 7.1 10.4 17.7 12.0
8 Russian Federation 0.0 1.8 3.6 3.0 4.3 3.0
9 Canada 20.5 5.4 21.0 16.6 12.4 15.4
10 Switzerland 0.0 16.7 25.9 28.5 25.3 24.4
11 Netherlands 6.5 27.8 16.6 19.6 8.0 16.5
12 Italy 12.5 4.3 12.0 28.0 16.5 17.8
13 China 9.4 0.0 0.0 1.3 3.9 2.9
14 Norway 0.0 0.0 61.5 48.1 23.1 30.8
15 Czech Republic 0.0 0.0 9.6 0.0 0.0 1.8
16 South Africa . . 100.0 83.8 29.4 44.6
17 Taiwan 100.0 0.0 42.9 0.0 8.4 11.5
18 Spain . 0.0 . 0.0 5.1 3.0
19 India 0.0 0.0 . 0.0 0.0 0.0
20 Denmark . 0.0 0.0 . 33.3 8.4
21 Hungary 0.0 0.0 0.0 0.0 0.0 0.0
22 Czechoslovakia 0.0 . . . . 0.0
23 Korea, Republic of . . . 0.0 0.0 0.0
24 Sweden 0.0 . 0.0 0.0 9.0 1.6
25 USSR 0.0 . . . . 0.0
26 Israel 66.7 0.0 . 0.0 0.0 25.4
27 New Zealand 0.0 . 50.0 100.0 0.0 14.7
28 Belgium . 40.0 . . 0.0 16.0
29 Indonesia 0.0 0.0 100.0 0.0 0.0 9.5
30 Portugal . . . 100.0 0.0 24.0
31 Argentina . . . 0.0 0.0 0.0
32 Brazil . . 0.0 . 0.0 0.0
33 Chile . 0.0 0.0 . 0.0 0.0
34 French Polynesia . . . 0.0 . 0.0
35 Iran, Islamic Republic of . . 0.0 . . 0.0
36 Ireland . 0.0 . . 0.0 0.0
37 Romania . . . . 0.0 0.0
38 Azerbaijan . . 0.0 . . 0.0
39 Finland . . . . 0.0 0.0
40 Mexico . . . . 0.0 0.0
41 Saudi Arabia . . . . 0.0 0.0
42 Turkey . 0.0 . . . 0.0
43 Ukraine . . . . 0.0 0.0
44 Viet Nam . . . 0.0 . 0.0

Share of publications among 10% most cited in field, fractionalized (%)


Bar chart of publication_year

Field normalized citation rate (cf), fractionalized

Obs Country 1990-1994 1995-1999 2000-2004 2005-2009 2010-2014 All years
1 All countries 1.70 1.50 1.36 1.43 1.32 1.44
2 United States 1.92 1.95 1.59 1.62 1.57 1.74
3 France 1.85 1.33 1.08 1.89 1.30 1.46
4 Germany 1.44 1.25 0.87 1.16 1.31 1.22
5 Japan 1.62 0.49 1.15 0.98 0.79 0.97
6 Australia 3.27 2.40 2.23 2.01 1.64 2.10
7 United Kingdom 1.36 1.66 0.77 0.93 2.03 1.37
8 Russian Federation 0.14 0.16 0.38 0.34 0.41 0.32
9 Canada 1.78 0.92 1.46 1.24 1.36 1.35
10 Switzerland 0.83 0.63 1.51 1.92 1.87 1.77
11 Netherlands 1.74 1.78 1.51 1.66 1.25 1.56
12 Italy 1.32 0.32 1.22 1.75 1.49 1.37
13 China 0.42 0.04 0.21 0.28 0.57 0.39
14 Norway 0.57 0.10 2.10 3.43 1.77 2.26
15 Czech Republic 0.21 0.26 0.60 0.73 0.76 0.52
16 South Africa . . 2.46 3.94 2.15 2.59
17 Taiwan 2.36 0.36 8.27 0.15 0.98 0.98
18 Spain . 0.89 . 0.65 0.92 0.83
19 India 0.00 0.19 . 0.43 0.13 0.14
20 Denmark . 0.64 0.17 . 0.95 0.60
21 Hungary 0.41 0.79 0.98 0.48 0.33 0.48
22 Czechoslovakia 0.26 . . . . 0.26
23 Korea, Republic of . . . 0.24 0.56 0.49
24 Sweden 0.49 . 0.29 0.68 1.71 0.71
25 USSR 0.06 . . . . 0.06
26 Israel 3.96 0.26 . 0.85 1.27 1.88
27 New Zealand 0.53 . 2.68 6.26 1.00 1.42
28 Belgium . 1.24 . . 0.61 0.86
29 Indonesia 1.01 1.03 3.72 0.00 0.00 0.70
30 Portugal . . . 2.85 1.16 1.56
31 Argentina . . . 0.15 1.60 0.93
32 Brazil . . 0.16 . 0.51 0.45
33 Chile . 1.25 1.03 . 1.32 1.21
34 French Polynesia . . . 1.01 . 1.01
35 Iran, Islamic Republic of . . 0.06 . . 0.06
36 Ireland . 0.15 . . 0.00 0.07
37 Romania . . . . 0.00 0.00
38 Azerbaijan . . 0.10 . . 0.10
39 Finland . . . . 0.71 0.71
40 Mexico . . . . 0.00 0.00
41 Saudi Arabia . . . . 0.44 0.44
42 Turkey . 0.29 . . . 0.29
43 Ukraine . . . . 0.00 0.00
44 Viet Nam . . . 1.02 . 1.02

Field normalized citation rate (cf), fractionalized


Bar chart of publication_year