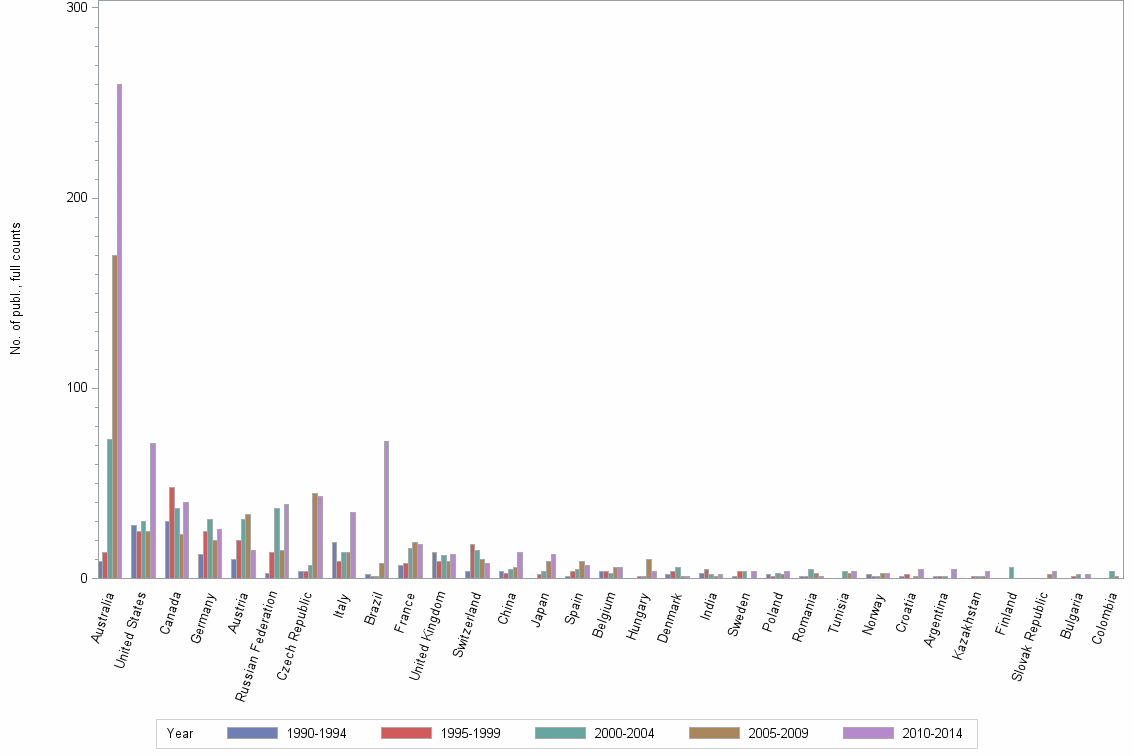
Lev1: INORGAN MAT PROGRAM//NEW MINERAL//PHYS CHEM SCI - Statistics for Countries

Statistics per Country

Number of publications, full counts

Obs Country 1990-1994 1995-1999 2000-2004 2005-2009 2010-2014 All years
1 All countries 147 177 261 313 461 1359
2 Australia 9 14 73 170 260 526
3 United States 28 25 30 25 71 179
4 Canada 30 48 37 23 40 178
5 Germany 13 25 31 20 26 115
6 Austria 10 20 31 34 15 110
7 Russian Federation 3 14 37 15 39 108
8 Czech Republic 4 4 7 45 43 103
9 Italy 19 9 14 14 35 91
10 Brazil 2 1 1 8 72 84
11 France 7 8 16 19 18 68
12 United Kingdom 14 9 12 9 13 57
13 Switzerland 4 18 15 10 8 55
14 China 4 3 5 6 14 32
15 Japan . 2 4 9 13 28
16 Spain 1 4 5 9 7 26
17 Belgium 4 4 3 6 6 23
18 Hungary . 1 1 10 4 16
19 Denmark 2 4 6 1 1 14
20 India 3 5 2 1 2 13
21 Sweden 1 4 4 . 4 13
22 Poland 2 1 3 2 4 12
23 Romania 1 1 5 3 1 11
24 Tunisia . . 4 3 4 11
25 Norway 2 1 1 3 3 10
26 Croatia 1 2 . 1 5 9
27 Argentina 1 1 1 . 5 8
28 Kazakhstan . 1 1 1 4 7
29 Finland . . 6 . . 6
30 Slovak Republic . . . 2 4 6
31 Bulgaria . 1 2 . 2 5
32 Colombia . . 4 1 . 5
33 Czechoslovakia 4 . . . . 4
34 South Africa 1 1 1 1 . 4
35 Egypt 1 . . . 2 3
36 Netherlands . . 2 1 . 3
37 Portugal . 1 . . 2 3
38 USSR 3 . . . . 3
39 Indonesia . 2 . . . 2
40 Luxembourg . . . . 2 2
41 Republic of Serbia . . . 1 1 2
42 Turkey . . . . 2 2
43 Yugoslavia 2 . . . . 2
44 Greece . . . . 1 1
45 Macedonia . . . . 1 1
46 Morocco . . . 1 . 1
47 New Zealand 1 . . . . 1
48 Peru . . . 1 . 1
49 Serbia Montenegro . . 1 . . 1
50 Slovenia . . . 1 . 1
51 Taiwan . . . . 1 1
52 Thailand . . . 1 . 1
53 Ukraine . . . . 1 1

Number of publications, full counts


Bar chart of publication_year

Share of the total number of publications in the field, full counts (%)

Obs Country 1990-1994 1995-1999 2000-2004 2005-2009 2010-2014 All years
1 All countries 100.0 100.0 100.0 100.0 100.0 100.0
2 Australia 6.1 7.9 28.0 54.3 56.4 38.7
3 United States 19.0 14.1 11.5 8.0 15.4 13.2
4 Canada 20.4 27.1 14.2 7.3 8.7 13.1
5 Germany 8.8 14.1 11.9 6.4 5.6 8.5
6 Austria 6.8 11.3 11.9 10.9 3.3 8.1
7 Russian Federation 2.0 7.9 14.2 4.8 8.5 7.9
8 Czech Republic 2.7 2.3 2.7 14.4 9.3 7.6
9 Italy 12.9 5.1 5.4 4.5 7.6 6.7
10 Brazil 1.4 0.6 0.4 2.6 15.6 6.2
11 France 4.8 4.5 6.1 6.1 3.9 5.0
12 United Kingdom 9.5 5.1 4.6 2.9 2.8 4.2
13 Switzerland 2.7 10.2 5.7 3.2 1.7 4.0
14 China 2.7 1.7 1.9 1.9 3.0 2.4
15 Japan . 1.1 1.5 2.9 2.8 2.1
16 Spain 0.7 2.3 1.9 2.9 1.5 1.9
17 Belgium 2.7 2.3 1.1 1.9 1.3 1.7
18 Hungary . 0.6 0.4 3.2 0.9 1.2
19 Denmark 1.4 2.3 2.3 0.3 0.2 1.0
20 India 2.0 2.8 0.8 0.3 0.4 1.0
21 Sweden 0.7 2.3 1.5 . 0.9 1.0
22 Poland 1.4 0.6 1.1 0.6 0.9 0.9
23 Romania 0.7 0.6 1.9 1.0 0.2 0.8
24 Tunisia . . 1.5 1.0 0.9 0.8
25 Norway 1.4 0.6 0.4 1.0 0.7 0.7
26 Croatia 0.7 1.1 . 0.3 1.1 0.7
27 Argentina 0.7 0.6 0.4 . 1.1 0.6
28 Kazakhstan . 0.6 0.4 0.3 0.9 0.5
29 Finland . . 2.3 . . 0.4
30 Slovak Republic . . . 0.6 0.9 0.4
31 Bulgaria . 0.6 0.8 . 0.4 0.4
32 Colombia . . 1.5 0.3 . 0.4
33 Czechoslovakia 2.7 . . . . 0.3
34 South Africa 0.7 0.6 0.4 0.3 . 0.3
35 Egypt 0.7 . . . 0.4 0.2
36 Netherlands . . 0.8 0.3 . 0.2
37 Portugal . 0.6 . . 0.4 0.2
38 USSR 2.0 . . . . 0.2
39 Indonesia . 1.1 . . . 0.1
40 Luxembourg . . . . 0.4 0.1
41 Republic of Serbia . . . 0.3 0.2 0.1
42 Turkey . . . . 0.4 0.1
43 Yugoslavia 1.4 . . . . 0.1
44 Greece . . . . 0.2 0.1
45 Macedonia . . . . 0.2 0.1
46 Morocco . . . 0.3 . 0.1
47 New Zealand 0.7 . . . . 0.1
48 Peru . . . 0.3 . 0.1
49 Serbia Montenegro . . 0.4 . . 0.1
50 Slovenia . . . 0.3 . 0.1
51 Taiwan . . . . 0.2 0.1
52 Thailand . . . 0.3 . 0.1
53 Ukraine . . . . 0.2 0.1

Share of the total number of publications in the field, full counts (%)


Bar chart of publication_year

Number of publications among 10% most cited in field, full counts

Obs Country 1990-1994 1995-1999 2000-2004 2005-2009 2010-2014 All years
1 All countries 7.8 6.4 16.9 15.2 3.8 50.1
2 Australia 1.5 0.0 12.4 10.0 2.5 26.4
3 United States 2.7 2.5 2.0 1.0 0.0 8.2
4 Canada 2.0 1.4 0.0 0.0 0.0 3.4
5 Germany 0.5 0.0 0.0 1.5 0.3 2.3
6 Austria 0.2 1.0 2.3 1.0 0.0 4.5
7 Russian Federation 0.0 0.5 0.0 0.0 0.0 0.5
8 Czech Republic 0.0 0.0 0.0 1.0 0.3 1.3
9 Italy 0.0 0.0 0.0 1.0 0.0 1.0
10 Brazil 0.0 0.0 0.0 0.0 0.0 0.0
11 France 0.2 0.0 0.1 0.0 0.0 0.3
12 United Kingdom 1.0 1.5 0.3 0.0 0.0 2.8
13 Switzerland 0.0 0.0 0.0 0.0 0.0 0.0
14 China 0.0 0.0 0.0 0.0 1.0 1.0
15 Japan . 0.0 0.0 0.0 0.0 0.0
16 Spain 0.0 0.0 0.0 0.0 0.0 0.0
17 Belgium 0.0 0.0 0.0 0.0 0.0 0.0
18 Hungary . 0.0 0.0 2.2 0.0 2.2
19 Denmark 0.0 0.0 0.0 0.0 0.0 0.0
20 India 0.0 0.0 0.0 0.0 0.0 0.0
21 Sweden 0.0 0.0 0.0 . 0.0 0.0
22 Poland 0.0 0.0 0.0 0.0 1.0 1.0
23 Romania 0.0 0.0 0.0 0.0 0.0 0.0
24 Tunisia . . 0.0 0.0 0.0 0.0
25 Norway 0.0 0.0 0.0 0.0 0.0 0.0
26 Croatia 0.0 0.0 . 0.0 0.0 0.0
27 Argentina 0.0 0.0 0.0 . 0.0 0.0
28 Kazakhstan . 0.0 0.0 0.0 0.0 0.0
29 Finland . . 0.0 . . 0.0
30 Slovak Republic . . . 0.0 0.0 0.0
31 Bulgaria . 0.0 1.0 . 0.0 1.0
32 Colombia . . 0.0 0.0 . 0.0
33 Czechoslovakia 0.0 . . . . 0.0
34 South Africa 0.0 0.0 0.0 0.0 . 0.0
35 Egypt 0.0 . . . 0.0 0.0
36 Netherlands . . 0.0 0.0 . 0.0
37 Portugal . 0.5 . . 0.0 0.5
38 USSR 0.0 . . . . 0.0
39 Indonesia . 0.0 . . . 0.0
40 Luxembourg . . . . 0.0 0.0
41 Republic of Serbia . . . 0.0 0.0 0.0
42 Turkey . . . . 0.0 0.0
43 Yugoslavia 0.0 . . . . 0.0
44 Greece . . . . 0.0 0.0
45 Macedonia . . . . 0.0 0.0
46 Morocco . . . 0.0 . 0.0
47 New Zealand 0.0 . . . . 0.0
48 Peru . . . 0.0 . 0.0
49 Serbia Montenegro . . 0.0 . . 0.0
50 Slovenia . . . 0.0 . 0.0
51 Taiwan . . . . 0.0 0.0
52 Thailand . . . 0.0 . 0.0
53 Ukraine . . . . 0.0 0.0

Number of publications among 10% most cited in field, full counts


Bar chart of publication_year

Share of publications among 10% most cited in field, fractionalized (%)

Obs Country 1990-1994 1995-1999 2000-2004 2005-2009 2010-2014 All years
1 All countries 5.3 3.6 6.5 4.9 0.8 3.7
2 Australia 18.2 0.0 19.1 5.9 1.0 6.0
3 United States 12.1 13.3 10.0 5.5 0.0 6.6
4 Canada 8.1 3.1 0.0 0.0 0.0 2.5
5 Germany 4.6 0.2 0.0 14.0 0.4 2.9
6 Austria 1.2 6.6 7.7 5.4 0.0 5.5
7 Russian Federation 0.0 4.0 0.0 0.0 0.0 0.5
8 Czech Republic 0.0 0.0 0.0 2.1 0.8 1.1
9 Italy 0.0 0.0 0.0 9.9 0.0 1.4
10 Brazil 0.0 0.0 0.0 0.0 0.0 0.0
11 France 1.8 0.0 1.1 0.0 0.0 0.5
12 United Kingdom 8.0 30.2 4.0 0.0 0.0 7.1
13 Switzerland 0.0 0.0 0.0 0.0 0.0 0.0
14 China 0.6 0.0 0.0 0.0 7.0 2.8
15 Japan . 0.0 0.0 0.0 0.0 0.0
16 Spain 0.0 0.0 0.0 0.0 0.0 0.0
17 Belgium 0.0 0.0 0.0 0.0 0.0 0.0
18 Hungary . 0.0 0.0 19.9 0.0 13.1
19 Denmark 0.0 0.0 0.0 0.0 0.0 0.0
20 India 0.0 0.0 0.0 0.0 0.0 0.0
21 Sweden 0.0 0.0 0.0 . 0.0 0.0
22 Poland 0.0 0.0 0.0 0.0 28.6 12.6
23 Romania 0.0 0.0 0.0 0.0 0.0 0.0
24 Tunisia . . 0.0 0.0 0.0 0.0
25 Norway 0.0 0.0 0.0 0.0 0.0 0.0
26 Croatia 0.0 0.0 . 0.0 0.0 0.0
27 Argentina 0.0 0.0 0.0 . 0.0 0.0
28 Kazakhstan . 0.0 0.0 0.0 0.0 0.0
29 Finland . . 0.0 . . 0.0
30 Slovak Republic . . . 0.0 0.0 0.0
31 Bulgaria . 0.0 33.3 . 0.0 11.1
32 Colombia . . 0.0 0.0 . 0.0
33 Czechoslovakia 0.0 . . . . 0.0
34 South Africa 0.0 0.0 0.0 0.0 . 0.0
35 Egypt 0.0 . . . 0.0 0.0
36 Netherlands . . 0.0 0.0 . 0.0
37 Portugal . 50.6 . . 0.0 10.1
38 USSR 0.0 . . . . 0.0
39 Indonesia . 0.0 . . . 0.0
40 Luxembourg . . . . 0.0 0.0
41 Republic of Serbia . . . 0.0 0.0 0.0
42 Turkey . . . . 0.0 0.0
43 Yugoslavia 0.0 . . . . 0.0
44 Greece . . . . 0.0 0.0
45 Macedonia . . . . 0.0 0.0
46 Morocco . . . 0.0 . 0.0
47 New Zealand 0.0 . . . . 0.0
48 Peru . . . 0.0 . 0.0
49 Serbia Montenegro . . 0.0 . . 0.0
50 Slovenia . . . 0.0 . 0.0
51 Taiwan . . . . 0.0 0.0
52 Thailand . . . 0.0 . 0.0
53 Ukraine . . . . 0.0 0.0

Share of publications among 10% most cited in field, fractionalized (%)


Bar chart of publication_year

Field normalized citation rate (cf), fractionalized

Obs Country 1990-1994 1995-1999 2000-2004 2005-2009 2010-2014 All years
1 All countries 2.12 0.79 0.85 0.67 0.41 0.79
2 Australia 0.45 0.31 1.35 0.85 0.39 0.70
3 United States 11.14 0.93 3.48 0.58 0.36 2.95
4 Canada 1.10 0.47 0.44 0.23 0.42 0.54
5 Germany 0.48 0.48 0.27 0.81 0.44 0.47
6 Austria 0.45 2.18 0.57 0.63 0.31 0.90
7 Russian Federation 0.24 0.35 0.25 0.36 0.28 0.29
8 Czech Republic 0.10 0.50 0.43 0.66 0.59 0.57
9 Italy 0.41 0.60 0.40 0.61 0.58 0.52
10 Brazil 0.09 0.20 0.35 0.29 0.48 0.44
11 France 0.75 0.21 0.54 0.76 0.33 0.53
12 United Kingdom 0.52 8.68 0.71 0.33 0.32 1.43
13 Switzerland 0.26 0.32 0.29 0.34 0.50 0.32
14 China 0.24 0.76 0.51 0.14 0.40 0.37
15 Japan . 0.18 0.26 0.12 0.11 0.14
16 Spain 0.35 0.34 0.32 0.53 0.66 0.48
17 Belgium 0.24 0.54 0.29 0.36 0.17 0.33
18 Hungary . 0.00 0.45 1.28 0.19 0.90
19 Denmark 0.23 0.10 0.35 0.08 0.30 0.23
20 India 0.43 0.18 0.49 0.32 0.24 0.31
21 Sweden 0.16 0.18 0.07 . 0.33 0.17
22 Poland 0.04 0.00 0.28 0.57 1.99 1.01
23 Romania 0.00 0.27 0.29 0.46 0.10 0.28
24 Tunisia . . 0.41 0.27 0.04 0.23
25 Norway 0.45 0.24 0.22 0.30 0.09 0.29
26 Croatia 0.33 0.09 . 0.16 0.59 0.33
27 Argentina 0.22 0.18 0.00 . 0.62 0.41
28 Kazakhstan . 0.27 0.47 0.00 0.16 0.17
29 Finland . . 0.19 . . 0.19
30 Slovak Republic . . . 0.70 0.18 0.32
31 Bulgaria . 0.38 0.83 . 0.11 0.41
32 Colombia . . 0.30 0.29 . 0.30
33 Czechoslovakia 0.11 . . . . 0.11
34 South Africa 0.17 0.22 0.05 0.44 . 0.22
35 Egypt 0.20 . . . 0.42 0.36
36 Netherlands . . 0.33 0.32 . 0.32
37 Portugal . 1.97 . . 0.18 0.54
38 USSR 0.26 . . . . 0.26
39 Indonesia . 0.00 . . . 0.00
40 Luxembourg . . . . 0.90 0.90
41 Republic of Serbia . . . 0.51 0.27 0.39
42 Turkey . . . . 0.00 0.00
43 Yugoslavia 0.38 . . . . 0.38
44 Greece . . . . 0.00 0.00
45 Macedonia . . . . 0.00 0.00
46 Morocco . . . 0.51 . 0.51
47 New Zealand 0.28 . . . . 0.28
48 Peru . . . 0.12 . 0.12
49 Serbia Montenegro . . 0.16 . . 0.16
50 Slovenia . . . 0.00 . 0.00
51 Taiwan . . . . 1.36 1.36
52 Thailand . . . 0.00 . 0.00
53 Ukraine . . . . 0.00 0.00

Field normalized citation rate (cf), fractionalized


Bar chart of publication_year