Class information for: |
Basic class information |
| ID | Publications | Average number of references |
Avg. shr. active ref. in WoS |
|---|---|---|---|
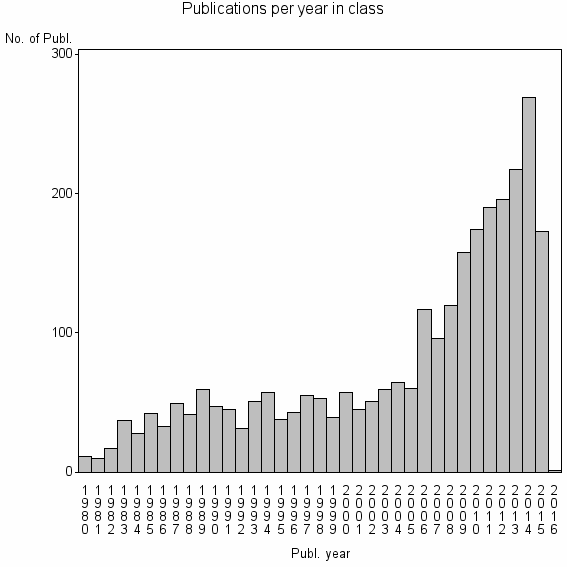
| 981 | 2833 | 34.0 | 57% |
Classes in level above (level 2) |
| ID, lev. above |
Publications | Label for level above |
|---|---|---|
| 38 | 32239 | BUSINESS, FINANCE//JOURNAL OF FINANCE//JOURNAL OF FINANCIAL ECONOMICS |
Terms with highest relevance score |
| Rank | Term | Type of term | Relevance score (tfidf) |
Class's shr. of term's tot. occurrences |
Shr. of publ. in class containing term |
Num. of publ. in class |
|---|---|---|---|---|---|---|
| 1 | VALUE PREMIUM | Author keyword | 63 | 83% | 1% | 35 |
| 2 | JOURNAL OF PORTFOLIO MANAGEMENT | Journal | 52 | 19% | 9% | 246 |
| 3 | CROSS SECTION OF STOCK RETURNS | Author keyword | 48 | 91% | 1% | 20 |
| 4 | STOCK RETURN PREDICTABILITY | Author keyword | 42 | 74% | 1% | 31 |
| 5 | ASSET PRICING | Author keyword | 34 | 21% | 5% | 144 |
| 6 | BOOK TO MARKET | Author keyword | 33 | 74% | 1% | 25 |
| 7 | BOOK TO MARKET EFFECT | Author keyword | 31 | 92% | 0% | 12 |
| 8 | RETURN PREDICTABILITY | Author keyword | 30 | 43% | 2% | 52 |
| 9 | MOMENTUM STRATEGIES | Author keyword | 24 | 91% | 0% | 10 |
| 10 | VALUE STOCKS | Author keyword | 24 | 91% | 0% | 10 |
Web of Science journal categories |
Author Key Words |
| Rank | Web of Science journal category | Relevance score (tfidf) |
Class's shr. of term's tot. occurrences |
Shr. of publ. in class containing term |
Num. of publ. in class |
LCSH search | Wikipedia search |
|---|---|---|---|---|---|---|---|
| 1 | VALUE PREMIUM | 63 | 83% | 1% | 35 | Search VALUE+PREMIUM | Search VALUE+PREMIUM |
| 2 | CROSS SECTION OF STOCK RETURNS | 48 | 91% | 1% | 20 | Search CROSS+SECTION+OF+STOCK+RETURNS | Search CROSS+SECTION+OF+STOCK+RETURNS |
| 3 | STOCK RETURN PREDICTABILITY | 42 | 74% | 1% | 31 | Search STOCK+RETURN+PREDICTABILITY | Search STOCK+RETURN+PREDICTABILITY |
| 4 | ASSET PRICING | 34 | 21% | 5% | 144 | Search ASSET+PRICING | Search ASSET+PRICING |
| 5 | BOOK TO MARKET | 33 | 74% | 1% | 25 | Search BOOK+TO+MARKET | Search BOOK+TO+MARKET |
| 6 | BOOK TO MARKET EFFECT | 31 | 92% | 0% | 12 | Search BOOK+TO+MARKET+EFFECT | Search BOOK+TO+MARKET+EFFECT |
| 7 | RETURN PREDICTABILITY | 30 | 43% | 2% | 52 | Search RETURN+PREDICTABILITY | Search RETURN+PREDICTABILITY |
| 8 | MOMENTUM STRATEGIES | 24 | 91% | 0% | 10 | Search MOMENTUM+STRATEGIES | Search MOMENTUM+STRATEGIES |
| 9 | VALUE STOCKS | 24 | 91% | 0% | 10 | Search VALUE+STOCKS | Search VALUE+STOCKS |
| 10 | PREDICTIVE REGRESSIONS | 23 | 79% | 1% | 15 | Search PREDICTIVE+REGRESSIONS | Search PREDICTIVE+REGRESSIONS |
Key Words Plus |
| Rank | Web of Science journal category | Relevance score (tfidf) |
Class's shr. of term's tot. occurrences |
Shr. of publ. in class containing term |
Num. of publ. in class |
|---|---|---|---|---|---|
| 1 | EXPECTED STOCK RETURNS | 234 | 53% | 11% | 315 |
| 2 | BOOK TO MARKET | 203 | 79% | 5% | 132 |
| 3 | EXPECTED RETURNS | 148 | 47% | 8% | 236 |
| 4 | COMMON STOCKS | 132 | 58% | 5% | 153 |
| 5 | OVERREACTION | 101 | 55% | 4% | 126 |
| 6 | DIVIDEND YIELDS | 94 | 61% | 4% | 100 |
| 7 | STOCK RETURNS | 77 | 15% | 17% | 472 |
| 8 | VALUE PREMIUM | 65 | 81% | 1% | 39 |
| 9 | ASSET PRICING ANOMALIES | 55 | 92% | 1% | 22 |
| 10 | CAPM | 51 | 56% | 2% | 61 |
Journals |
| Rank | Web of Science journal category | Relevance score (tfidf) |
Class's shr. of term's tot. occurrences |
Shr. of publ. in class containing term |
Num. of publ. in class |
|---|---|---|---|---|---|
| 1 | JOURNAL OF PORTFOLIO MANAGEMENT | 52 | 19% | 9% | 246 |
| 2 | JOURNAL OF EMPIRICAL FINANCE | 11 | 15% | 2% | 68 |
| 3 | FINANCIAL ANALYSTS JOURNAL | 8 | 12% | 2% | 59 |
| 4 | PACIFIC-BASIN FINANCE JOURNAL | 4 | 11% | 1% | 33 |
| 5 | JOURNAL OF FINANCIAL RESEARCH | 4 | 10% | 1% | 33 |
| 6 | INVESTMENT ANALYSTS JOURNAL | 3 | 18% | 1% | 17 |
| 7 | JASSA-THE FINSIA JOURNAL OF APPLIED FINANCE | 1 | 12% | 0% | 6 |
Reviews |
| Title | Publ. year | Cit. | Active references | % act. ref. to same field |
|---|---|---|---|---|
| Stock return forecasting: Some new evidence | 2015 | 2 | 66 | 53% |
| Is size dead? A review of the size effect in equity returns | 2011 | 15 | 70 | 84% |
| EFFICIENT CAPITAL-MARKETS .2. | 1991 | 915 | 106 | 42% |
| The Cross-Section of Expected Stock Returns: What Have We Learnt from the Past Twenty-Five Years of Research ? | 2010 | 20 | 99 | 71% |
| Investor psychology and security market under- and overreactions | 1998 | 765 | 74 | 26% |
| A review of the international literature on the short term predictability of stock prices conditional on large prior price changes: Microstructure, behavioral and risk related explanations | 2013 | 2 | 40 | 70% |
| DOES IDIOSYNCRATIC VOLATILITY MATTER IN THE EMERGING MARKETS? ISTANBUL STOCK EXCHANGE EVIDENCE | 2013 | 0 | 26 | 92% |
| THE PRICING OF SIZE, BOOK TO MARKET AND FINANCIAL LEVERAGE IN EURO STOCKS | 2013 | 0 | 11 | 82% |
| The CAPM is Alive and Well: A Review and Synthesis | 2010 | 7 | 24 | 38% |
| Behavioral finance: How matters stand | 2004 | 9 | 30 | 57% |
Address terms |
| Rank | Address term | Relevance score (tfidf) |
Class's shr. of term's tot. occurrences |
Shr. of publ. in class containing term |
Num. of publ. in class |
|---|---|---|---|---|---|
| 1 | AREA FINANCE | 7 | 67% | 0.2% | 6 |
| 2 | GLOBAL QUANTITAT | 4 | 75% | 0.1% | 3 |
| 3 | MENDOZA BUSINESS 239 | 2 | 67% | 0.1% | 2 |
| 4 | FINANCIAL ANAL | 2 | 40% | 0.1% | 4 |
| 5 | AMOS TUCK BUSINESS | 1 | 31% | 0.1% | 4 |
| 6 | LKC BUSINESS | 1 | 38% | 0.1% | 3 |
| 7 | EAFE GLOBAL ACT EQU STRATEGIES | 1 | 100% | 0.1% | 2 |
| 8 | ECON FINANACE | 1 | 50% | 0.1% | 2 |
| 9 | FINANCE SECUR | 1 | 50% | 0.1% | 2 |
| 10 | FINANCES BANKING ACCOUNTANCY | 1 | 100% | 0.1% | 2 |
Related classes at same level (level 1) |
| Rank | Relatedness score | Related classes |
|---|---|---|
| 1 | 0.0000220346 | SELL IN MAY//DAY OF THE WEEK EFFECT//CALENDAR ANOMALIES |
| 2 | 0.0000182554 | MUTUAL FUNDS//HEDGE FUNDS//FUND FLOWS |
| 3 | 0.0000162277 | EQUITY PREMIUM//LONG RUN RISK//EQUITY PREMIUM PUZZLE |
| 4 | 0.0000147170 | PAIRS TRADING//REMOTE CLIENTS//AMER BUSINESS |
| 5 | 0.0000131619 | RATIONAL BUBBLES//INTRINSIC BUBBLES//PERIODICALLY COLLAPSING BUBBLES |
| 6 | 0.0000125092 | FLEXIBLE LEAST SQUARES//ALGORITHMIC TRADING SYSTEM//FINANCE MODELS |
| 7 | 0.0000122066 | DISPOSITION EFFECT//HOME BIAS//INDIVIDUAL INVESTORS |
| 8 | 0.0000110024 | INFLATION ILLUSION//PROXY HYPOTHESIS//FISHER HYPOTHESIS |
| 9 | 0.0000106356 | JOURNAL OF FINANCIAL MARKETS//MARKET MICROSTRUCTURE//LIQUIDITY |
| 10 | 0.0000099831 | CONTAGION//STOCK MARKET INTEGRATION//STOCK MARKETS |